#xauusd #xᴀᴜᴜsᴅ
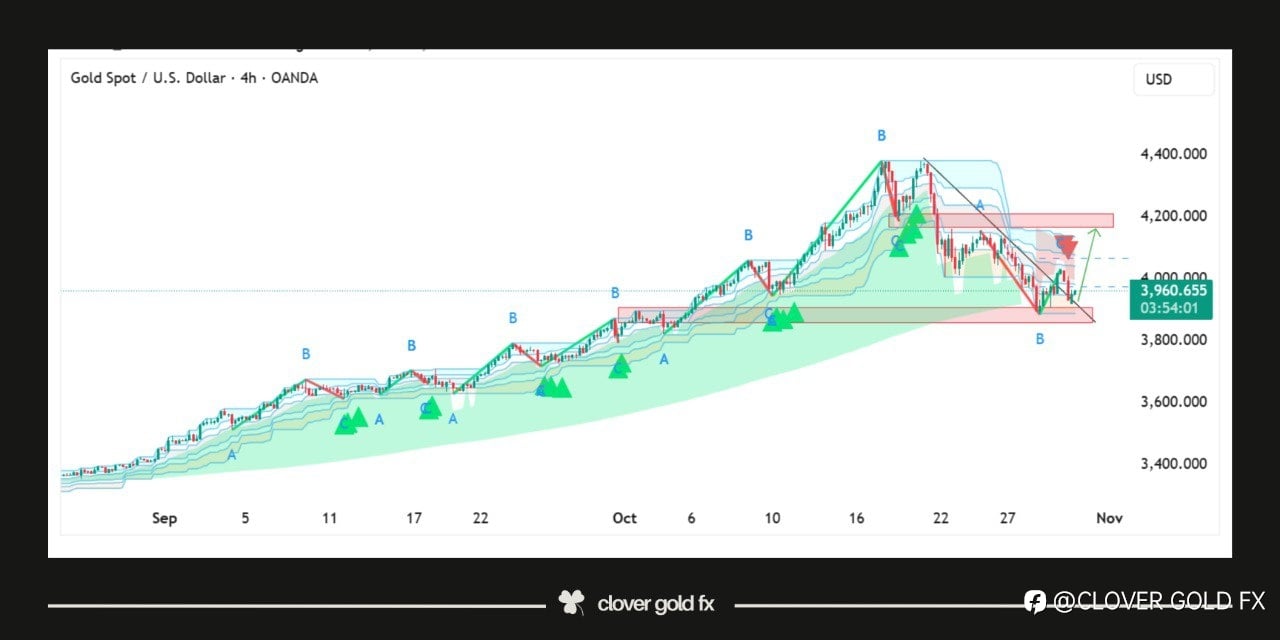
Gold on the 4H chart shows that the market completed a five wave bullish structure and after reaching the top it started a corrective phase that moved down in three clear waves labeled a b and c the price is reacting around the horizontal support zone where buyers are trying to regain control the descending trend line marks the limit of the corrective phase and a breakout above it may indicate the start of a fresh upward movement the pattern suggests that gold might build strength around this area before targeting higher levels again showing a possible shift from correction to continuation of the overall bullish trend
Peringatan: Pendapat yang disampaikan sepenuhnya merupakan milik penulis dan tidak mencerminkan posisi resmi Followme. Followme tidak bertanggung jawab atas keakuratan, kelengkapan, atau keandalan informasi yang disediakan, serta tidak bertanggung jawab atas tindakan apa pun yang diambil berdasarkan konten ini, kecuali dinyatakan secara tertulis.

Tinggalkan pesan Anda sekarang