


WTI PRICE ANLYSIS: DAILY CHART
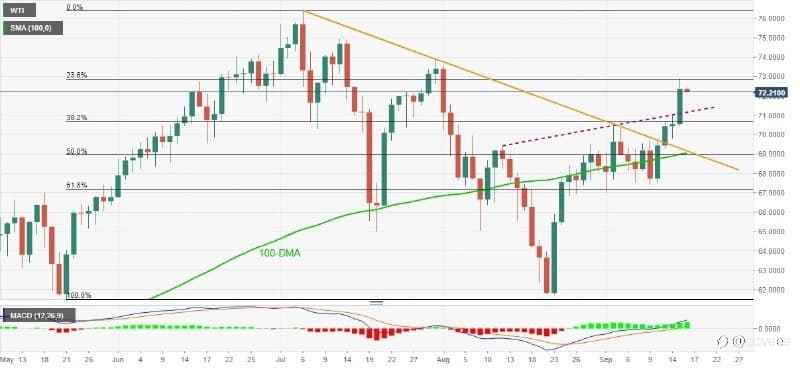
WTI combines weekly gains around multi-day high, 0.20% intraday near $72.20 during early Thursday. The oil standard jumped to the highest level since August 02 but failed to cross 23.6% Fibonacci retracement of May–July upside.
Even so, bullish MACD and the Oil's ability to cross monthly resistance line, falling trend line from early July, also stay firmer beyond 100-DMA, keep WTI oil buyers confident.
As of now, an upside clearance of the 23.6% Fibonacci retracement level of $72.85 will aim for July 30 top of $73.88 and the mid-July peak surrounding $75.00
Hello Traders keep a close look at oil's price for we are still expecting a bullish continuation meaning Buyers can still take advantage of this movement and turn this into profit however scalpers can also earn from the minor bounce back down or its retracement cause price might go down before it continues its bullish movement
Peringatan: Pendapat yang disampaikan sepenuhnya merupakan milik penulis dan tidak mencerminkan posisi resmi Followme. Followme tidak bertanggung jawab atas keakuratan, kelengkapan, atau keandalan informasi yang disediakan, serta tidak bertanggung jawab atas tindakan apa pun yang diambil berdasarkan konten ini, kecuali dinyatakan secara tertulis.
 Belum ada komentar. Jadil yang pertama untuk membagikan komentar.
