


₿ BTC/USD — 1H Technical Market Structure Analysis
📊 Price: ~84,450 | OANDA | 1H Chart
Chart-based technical analysis only — scenarios and levels, not guaranteed outcomes or financial advice.
🧭 1. Market Structure
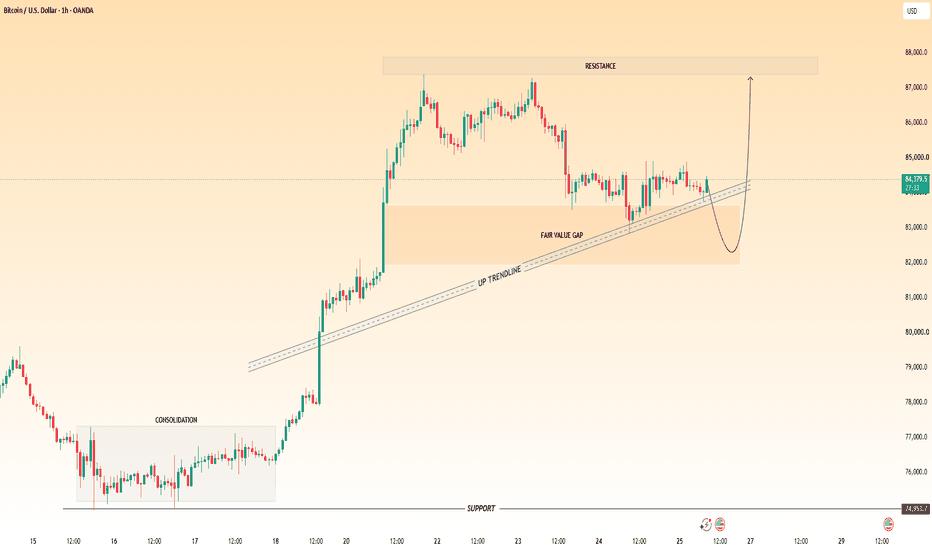
The chart shows a strong impulsive advance from the ~$76K consolidation area toward ~$87K, followed by a period of sideways consolidation.
Major low/base: ~$75K–77K
Impulse: ~$78K → ~$87K
Current consolidation: roughly $83K–85K
Price remains above the rising 1H trendline drawn from the earlier breakout.
The market is currently compressing beneath the ~$87K resistance area.
Structurally, this is a bullish trend with short-term consolidation, provided the rising structure continues to hold.
🟢 2. Key Support / Demand Zones
$83,000–$84,000 — Immediate support
This area is particularly important because it overlaps with:
Rising trendline
Recent reaction lows
Lower portion of the marked Fair Value Gap
Current consolidation structure
A sustained hold here would preserve the current bullish structure.
$82,000–$83,000 — Major FVG / structural support
The chart marks a substantial Fair Value Gap (FVG) extending approximately through the $82K–$84K region.
A deeper retracement into this zone could represent a liquidity/imbalance fill rather than automatically meaning a trend reversal.
~$74,950 — Major historical support
The horizontal support around $74,953 is substantially below the current price and represents the larger structural floor visible on this chart.
🔴 3. Resistance
$86,800–$88,000 — Major resistance zone
This is the most important upside area shown.
Price has already encountered rejection around ~$87K, making this region a clear supply/resistance area on the chart.
A meaningful bullish continuation would require price to:
consolidate → break resistance → hold above it
rather than simply wick through it.
📐 4. Trendline Analysis
The rising trendline is one of the most important features of this setup.
Price has repeatedly interacted with this ascending structure while maintaining higher lows.
Bullish structure:
Higher lows + trendline holding + $83K/$84K support defended
Structural warning:
A decisive break beneath the trendline followed by failure to reclaim it would weaken the current setup.
⚠️ Important: A single candle wick below support is not necessarily a confirmed breakdown. Look for candle closes, follow-through and retest behavior.
🟡 5. Fair Value Gap
The marked FVG between roughly $82K–$84K is significant.
There are two possible technical interpretations:
Scenario A — FVG acts as support 🟢
Price enters the imbalance, finds demand, and reclaims the upper portion → bullish structure remains intact.
Scenario B — FVG fails 🔴
Price moves through the zone and cannot reclaim it → attention shifts toward lower structural support.
The reaction after entering the FVG is more informative than simply touching it.
🎯 6. Scenario Map
🟢 Bullish continuation scenario
$84K area holds → trendline holds → $85K reclaimed → $86K → $87K–$88K resistance tested
A clean break and successful retest of the upper resistance zone would change the structure from range/consolidation toward continuation.
🟡 Range / consolidation scenario
BTC continues oscillating approximately between:
$83K–$85K
This would indicate that buyers and sellers are still balancing before the next directional expansion.
For this scenario, repeated failed attempts at ~$87K and repeated defenses around ~$83K would reinforce the range.
🔴 Bearish structural scenario
Trendline breaks → $83K fails → FVG loses support → $82K becomes resistance
That would weaken the current bullish market structure and open the possibility of a deeper retracement toward lower support.
The key distinction is acceptance below support, not merely an intraday spike.
📋 Key Levels at a Glance
Level Role
$87K–$88K 🔴 Major resistance
$86K ⚠️ Intermediate resistance
$84K–$85K 🟡 Current consolidation
$83K–$84K 🟢 Immediate support / trendline
$82K–$83K 🟢 Major FVG support
~$75K 🟢 Major structural support
🧠 Professional Read
The chart currently presents a bullish higher-timeframe structure on the displayed 1H sequence, but price is still trapped inside consolidation beneath major resistance.
The critical battle is essentially:
🟢 $83K–$84K support vs. 🔴 $87K–$88K resistance
Until one side is convincingly broken and subsequently confirmed, treating the middle of the range as a high-confidence directional signal would be premature.
🔑 Levels to watch
Above $87K–$88K: resistance-breakout confirmation becomes the key technical event.
$83K–$84K: immediate structural defense.
$82K: important downside structural level.
Below the rising trendline + failed reclaim: bullish structure becomes materially weaker.
📌 TradingView-style takeaway:
“BTC is consolidating above rising support and inside the marked FVG, with $83K–$84K acting as the key structural defense and $87K–$88K as the major upside barrier. Wait for confirmation rather than assuming the next move.”
Peringatan: Pendapat yang disampaikan sepenuhnya merupakan milik penulis dan tidak mencerminkan posisi resmi Followme. Followme tidak bertanggung jawab atas keakuratan, kelengkapan, atau keandalan informasi yang disediakan, serta tidak bertanggung jawab atas tindakan apa pun yang diambil berdasarkan konten ini, kecuali dinyatakan secara tertulis.
 Belum ada komentar. Jadil yang pertama untuk membagikan komentar.