


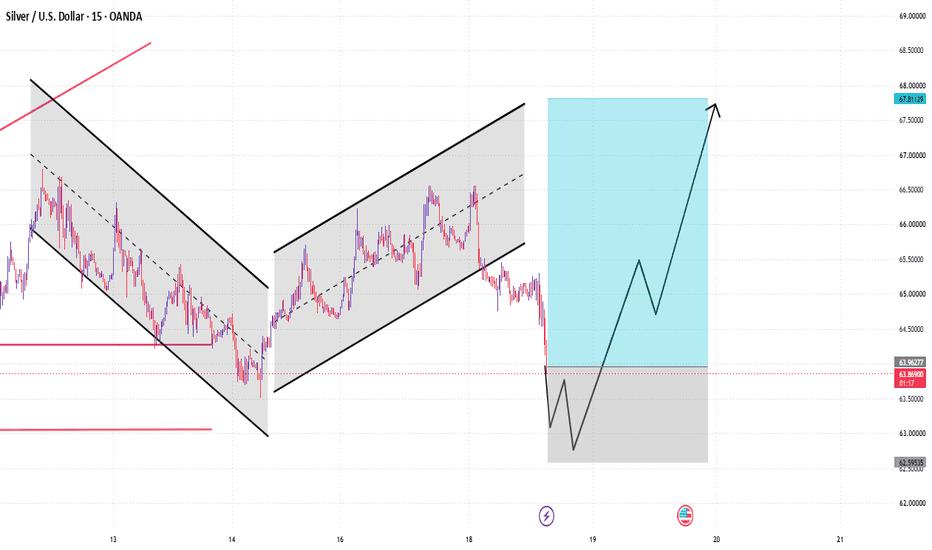
The 15-minute Silver chart shows a transition from a declining channel into a rising channel. Price later reached the upper part of the recovery structure near 66.50, followed by a sharp correction.
Current price is around 63.939, and the recent move has brought price back toward the marked support region.
Important Areas:
63.40 — First support
63.00 — Important lower support
62.80 — Deeper reference area
If price finds stability in this region, the chart projection shows possible recovery levels:
64.50 → 65.50 → 67.00 → 67.50–67.70
Structure to Watch:
Current: 63.94
⬇ 63.40
⬇ 63.00
⬇ 62.80
⬆ 64.50
⬆ 65.50
⬆ 67.00
⬆ 67.50–67.70
A sustained move below the lower support area would weaken the recovery scenario, while a return above 64.50 would indicate improving short-term structure.
Peringatan: Pendapat yang disampaikan sepenuhnya merupakan milik penulis dan tidak mencerminkan posisi resmi Followme. Followme tidak bertanggung jawab atas keakuratan, kelengkapan, atau keandalan informasi yang disediakan, serta tidak bertanggung jawab atas tindakan apa pun yang diambil berdasarkan konten ini, kecuali dinyatakan secara tertulis.
 Belum ada komentar. Jadil yang pertama untuk membagikan komentar.