


Market Thesis:
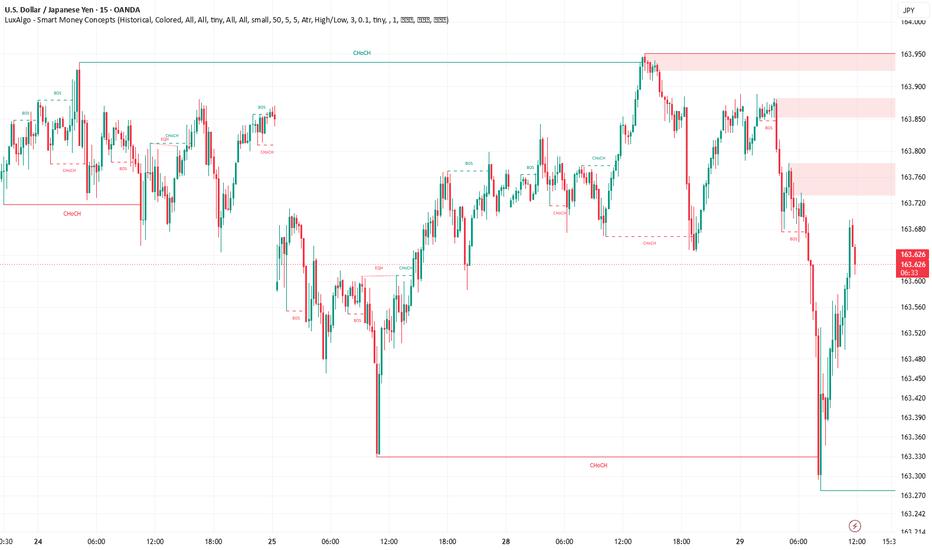
USD/JPY swept beneath the 163.330 structural low, reaching approximately 163.270, before producing an aggressive rebound toward 163.652. This suggests sell-side liquidity was taken, but the broader 15-minute order flow remains bearish while price trades beneath multiple stacked supply zones.
The recovery becomes structurally bullish only if buyers reclaim 163.680–163.720 and sustain acceptance above that area.
Visible Confluences — 15-Minute Chart:
Recent bearish BOS signals are visible around 163.850 and 163.665, confirming downside structural pressure.
Price penetrated the major 163.330 CHoCH low and immediately recovered from approximately 163.270—a clear sell-side liquidity sweep.
Current price is rebounding into the former breakdown area around 163.650–163.680.
Nearest visible red supply zone: 163.735–163.780.
Secondary supply zone: 163.845–163.880.
Major upper supply zone: 163.925–163.950, aligned with the previous major CHoCH high.
No visible FVG or explicitly labelled Order Block is present on this chart, so neither is used as confirmation.
Trade Scenarios:
Setup 1 — Primary Sell Continuation
Direction: Sell
Entry Zone: 163.735–163.780
Trigger: Price enters the supply zone and prints a 1-minute or 5-minute bearish CHoCH, rejection sequence, or strong bearish momentum close beneath 163.720.
Stop Loss: 163.805
TP1: 163.680
TP2: 163.600
TP3: 163.330
This is the preferred scenario while the 15-minute structure remains below the nearest supply zone.
Setup 2 — Conditional Bullish Reversal
Direction: Buy
Entry Zone: 163.650–163.680
Trigger: A 15-minute candle closes above 163.680, followed by a lower-timeframe bullish CHoCH and successful retest of 163.650.
Stop Loss: 163.600
TP1: 163.720
TP2: 163.760
TP3: 163.850
This is a confirmation-dependent setup. Buying before structural reclamation would mean trading directly against the visible bearish BOS sequence.
Setup 3 — Secondary Premium Sell
Direction: Sell
Entry Zone: 163.845–163.880
Trigger: Bearish lower-timeframe structural shift or decisive rejection, followed by a close beneath 163.840.
Stop Loss: 163.905
TP1: 163.780
TP2: 163.720
TP3: 163.600
A sustained 15-minute close above 163.950 would invalidate the broader bearish supply thesis shown on this chart.
Refinement Tip:
These are 15-minute reference zones. For the best risk-to-reward profile, monitor the zones on the 1-minute and 5-minute charts for liquidity reactions, momentum candles, and confirmed LTF CHoCH signals before execution. Avoid entering solely because price touches a level.
⚠️ Disclaimer:
Trading financial markets involves significant risk, and no setup or analytical framework can guarantee an outcome. This analysis reflects the visible market structure and probability conditions at the time of the screenshot. It is provided strictly for educational and analytical purposes and should not be treated as personalized financial advice. Always apply disciplined position sizing, predetermined risk limits, and independent judgment.
Peringatan: Pendapat yang disampaikan sepenuhnya merupakan milik penulis dan tidak mencerminkan posisi resmi Followme. Followme tidak bertanggung jawab atas keakuratan, kelengkapan, atau keandalan informasi yang disediakan, serta tidak bertanggung jawab atas tindakan apa pun yang diambil berdasarkan konten ini, kecuali dinyatakan secara tertulis.
 Belum ada komentar. Jadil yang pertama untuk membagikan komentar.