


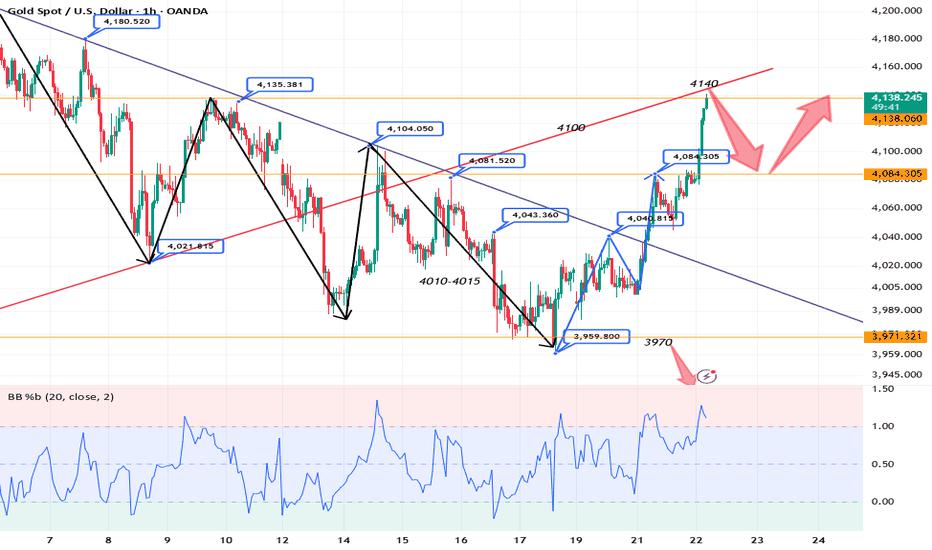
Yesterday, gold retraced to $4000 before continuing its upward trend. It surged to $4084 in the European session before pulling back, then fell to $4045 in the US session before rising again, closing at $4077, resulting in a significant gain on the daily chart. Today, gold continued its upward trend, breaking above $4100 and currently trading around $4130. The KDJ indicator shows a golden cross, with accompanying indicators turning upwards. The MACD indicator shows a significant increase in upward momentum, indicating a bullish bias on the daily chart.
On the hourly chart, gold retraced to $4074 in the Asian session before rising sharply again. Moving averages are in a bullish alignment, and the MACD indicator's fast and slow lines have crossed above the zero line with an expanding crossover. The MACD histogram is increasing, and the trend indicator is in overbought territory, suggesting that the short-term upside potential for gold may be limited, and a pullback is possible. Given the bullish daily trend, intraday trading should focus on buying on pullbacks, with short-term holdings and selling opportunities. Support levels to watch are the $4100 level.
My recommendations:
BUY: 4085-4090, SL: 4075, TP: 4120-4130
SELL: 4134-4139, SL: 4150, TP: 4110-4100
Peringatan: Pendapat yang disampaikan sepenuhnya merupakan milik penulis dan tidak mencerminkan posisi resmi Followme. Followme tidak bertanggung jawab atas keakuratan, kelengkapan, atau keandalan informasi yang disediakan, serta tidak bertanggung jawab atas tindakan apa pun yang diambil berdasarkan konten ini, kecuali dinyatakan secara tertulis.
 Belum ada komentar. Jadil yang pertama untuk membagikan komentar.