


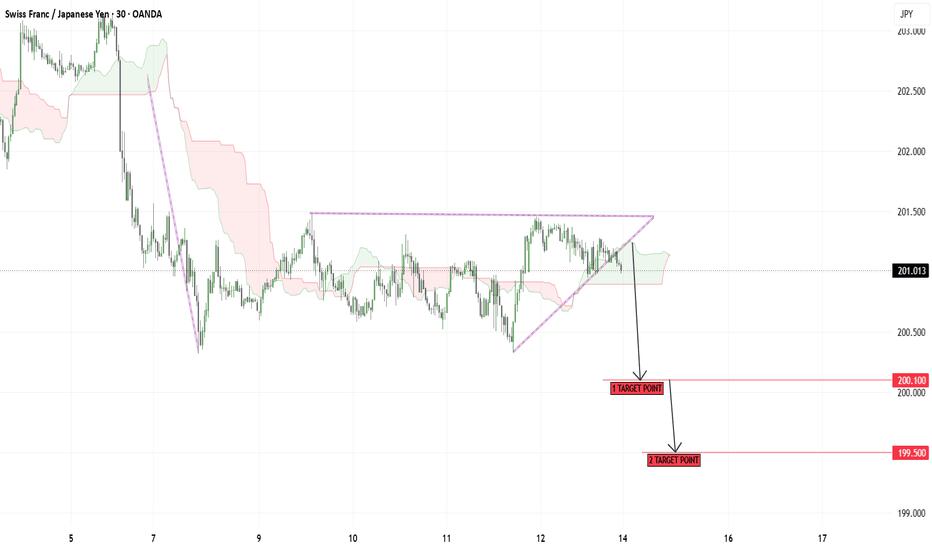
📊 CHFJPY – Bearish Triangle Breakdown Setup
🔍 Market Overview
CHFJPY is trading within a contracting triangle formation after an extended period of consolidation. Price is currently testing the lower boundary of the structure, while bullish momentum continues to weaken near resistance.
The inability to break above the upper trendline suggests buyers are losing strength, increasing the probability of a downside breakout toward lower support levels.
📉 Market Structure Insight
* Market Bias: Bearish
* Momentum: Weakening
* Current Phase: Triangle Breakdown Setup
As long as price remains below the upper trendline resistance and fails to reclaim recent highs, the bearish outlook remains favored.
---
🚀 Trading Scenarios
🔴 Bearish Scenario (Primary Setup)
Conditions: • Triangle support breaks decisively
* Price remains below resistance trendline
* Selling momentum accelerates after breakdown
Trade Plan: Look for short opportunities following a confirmed breakdown or retest of the broken structure.
🎯 Target 1: 200.100
🎯 Target 2: 199.500
---
🟢 Bullish Invalidation Scenario
Conditions: • Strong breakout above triangle resistance
* Sustained trading above recent swing highs
* Buyers regain momentum with higher highs
Trade Plan: A confirmed breakout above the pattern could invalidate the bearish setup and trigger a move toward higher resistance levels.
🎯 Bullish Expansion Zone: 201.500 – 202.000
---
📍 Key Levels to Monitor
🔴 Immediate Resistance: 201.300
🔴 Major Resistance: 201.500
🟢 Target Support 1: 200.100
🟢 Target Support 2: 199.500
---
⚠️ Trading Perspective
CHFJPY is approaching a critical decision point as price compresses within a triangle structure. Breakdowns from such consolidations often lead to sharp directional moves. Current price action favors sellers, but confirmation remains essential before committing to a position.
---
🧠 Professional Insight
This setup is supported by:
* Triangle compression pattern
* Multiple rejections from resistance
* Weak bullish follow-through
* Bearish pressure near trendline support
* Potential volatility expansion after breakout
The highest-probability trades typically occur after a confirmed break and retest rather than anticipating the move before confirmation.
---
🛡️ Risk Management
* Risk only 1–2% per trade
* Place stop loss above the triangle resistance
* Wait for a candle close confirmation before entry
* Avoid entering during low-volume consolidation
* Maintain a minimum 1:2 risk-to-reward ratio whenever possible
Peringatan: Pendapat yang disampaikan sepenuhnya merupakan milik penulis dan tidak mencerminkan posisi resmi Followme. Followme tidak bertanggung jawab atas keakuratan, kelengkapan, atau keandalan informasi yang disediakan, serta tidak bertanggung jawab atas tindakan apa pun yang diambil berdasarkan konten ini, kecuali dinyatakan secara tertulis.
 Belum ada komentar. Jadil yang pertama untuk membagikan komentar.