



Overall Market Context and Trend
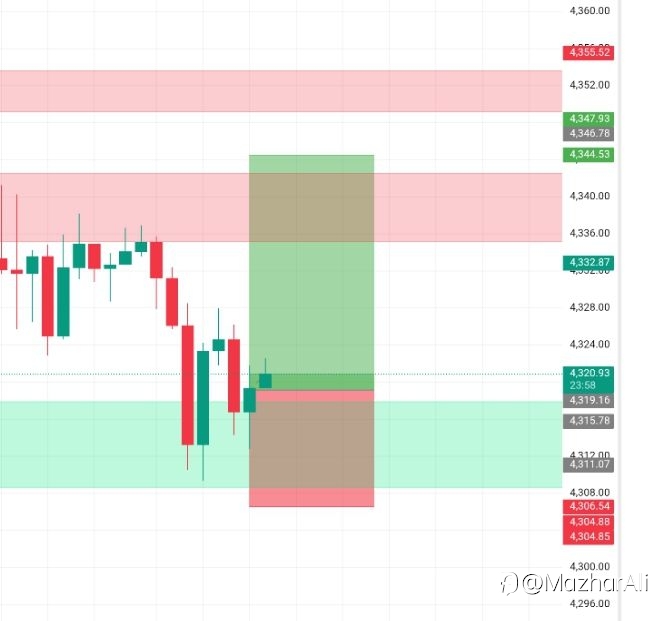
The chart displays a clear downtrend on the given timeframe. Price has made a series of lower highs and lower lows, with the most recent swing pushing into a significant Volume Profile node (the highlighted horizontal bar), indicating a potential support or consolidation zone. The current price action shows a minor pullback or consolidation within this downtrend.
Key Technical Levels
· Immediate Resistance: 4.364.00 (Recent swing high of the pullback).
· Primary Resistance & Entry Zone: 4.320 - 4.328 area (Confluence of the Volume Profile Point of Control (POC) high and prior minor resistance).
· Current Support (Consolidation Low): 4.284.00
· Major Downside Targets:
· TP1: 4.260.00 (Recent swing low, round number support).
· TP2: 4.200.00 (Major horizontal support & round number).
· TP3: ~4.185 (Extension towards the Volume Profile low).
Trade Setup: Short (SELL) on Rejection of Resistance
This setup anticipates a continuation of the prevailing downtrend after a corrective pullback.
1. Entry Zone: 4.315 - 4.328
· Rationale: This area is a confluence of:
· The high boundary of the current consolidation/Volume Profile node.
· A potential retest of the breakdown level from the prior down move.
· A logical level for sellers to re-enter amid the downtrend.
2. Stop Loss (SL): 4.365
· Placed just above the recent pullback high (4.364.00) and the more significant 4.365.26 level. A break above this invalidates the immediate bearish structure.
3. Take-Profit Targets (TPs):
· TP1: 4.284 → ~1:1 Risk/Reward (R/R). Prior consolidation low and immediate support.
· TP2: 4.260 → ~2:1 R/R. Recent significant swing low and round number.
· TP3: 4.200 → ~4:1 R/R. Major horizontal support and the ultimate target for the downtrend leg.
Risk Management
· Position size should be calculated so that a loss from entry to the stop-loss level is an acceptable percentage of your trading capital (typically 1-2%).
· Consider moving stop-loss to break-even or trailing it after price reaches TP1 to lock in profit and reduce risk on the remainder of the position targeting TP2 and TP3.
Peringatan: Pendapat yang disampaikan sepenuhnya merupakan milik penulis dan tidak mencerminkan posisi resmi Followme. Followme tidak bertanggung jawab atas keakuratan, kelengkapan, atau keandalan informasi yang disediakan, serta tidak bertanggung jawab atas tindakan apa pun yang diambil berdasarkan konten ini, kecuali dinyatakan secara tertulis.
 Belum ada komentar. Jadil yang pertama untuk membagikan komentar.