


In this technical blog, we will look at the past performance of the 1-hour Elliott Wave Charts of XLF. We presented to members at the elliottwave-forecast. In which, the rally from the 07 April 2025 low is unfolding as an impulse structure. Also showed a higher high sequence suggested that ETF should see more upside extension to complete the impulse sequence. Therefore, we advised members not to sell the ETF & buy the dips in 3, 7, or 11 swings at the blue box areas. We will explain the structure & forecast below:
XLF 1-Hour Elliott Wave Chart From 7.15.2025
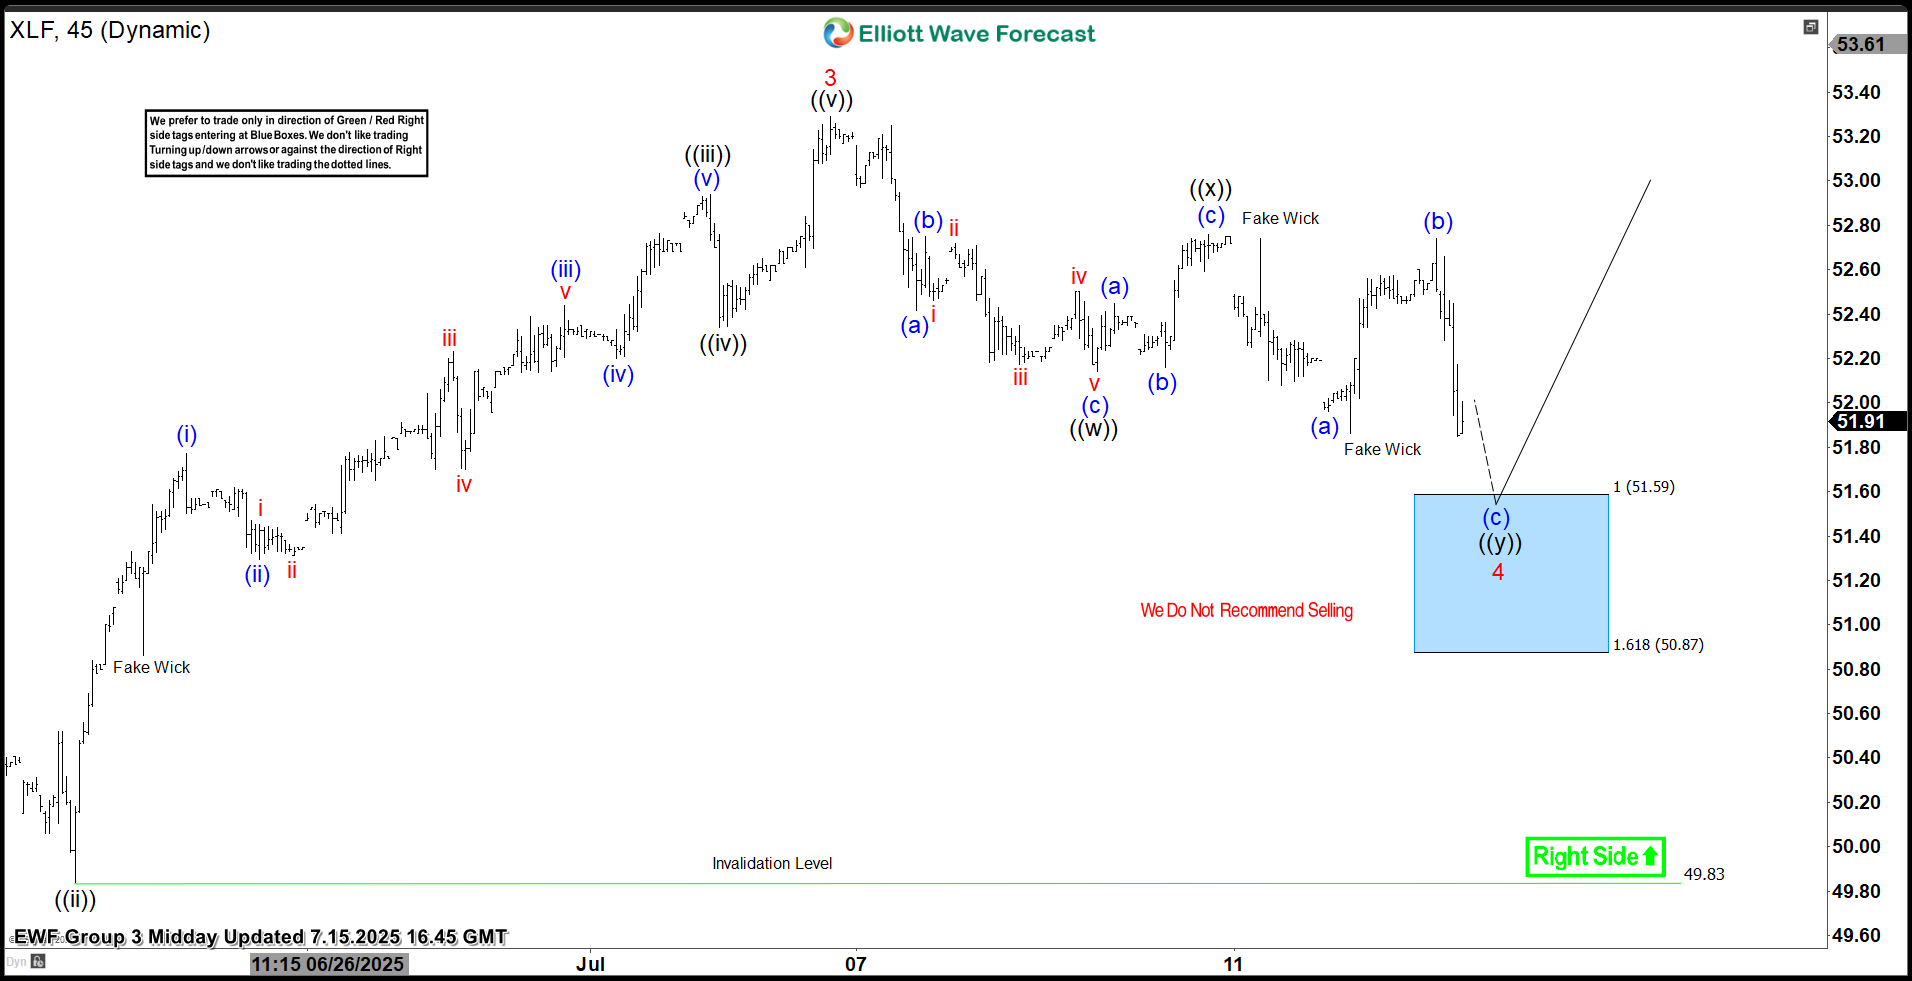
Here’s the 1-hour Elliott wave chart from the 7.15.2025 Midday update. In which, the short-term cycle from the 4.10.2025 low ended in wave 3 as impulse at $53.29 high. Down from there, the ETF made a pullback in wave 4 to correct that cycle. The internals of that pullback unfolded as Elliott wave double three structure where wave ((w)) ended at $52.14 low. Wave ((x)) bounce ended at $52.76 high. Then wave ((y)) managed to reach the blue box area at $51.59- $50.87. From there, buyers were expected to appear looking for the next leg higher or for a 3 wave bounce minimum.
XLF 1-Hour Elliott Wave Chart From 7.28.2025
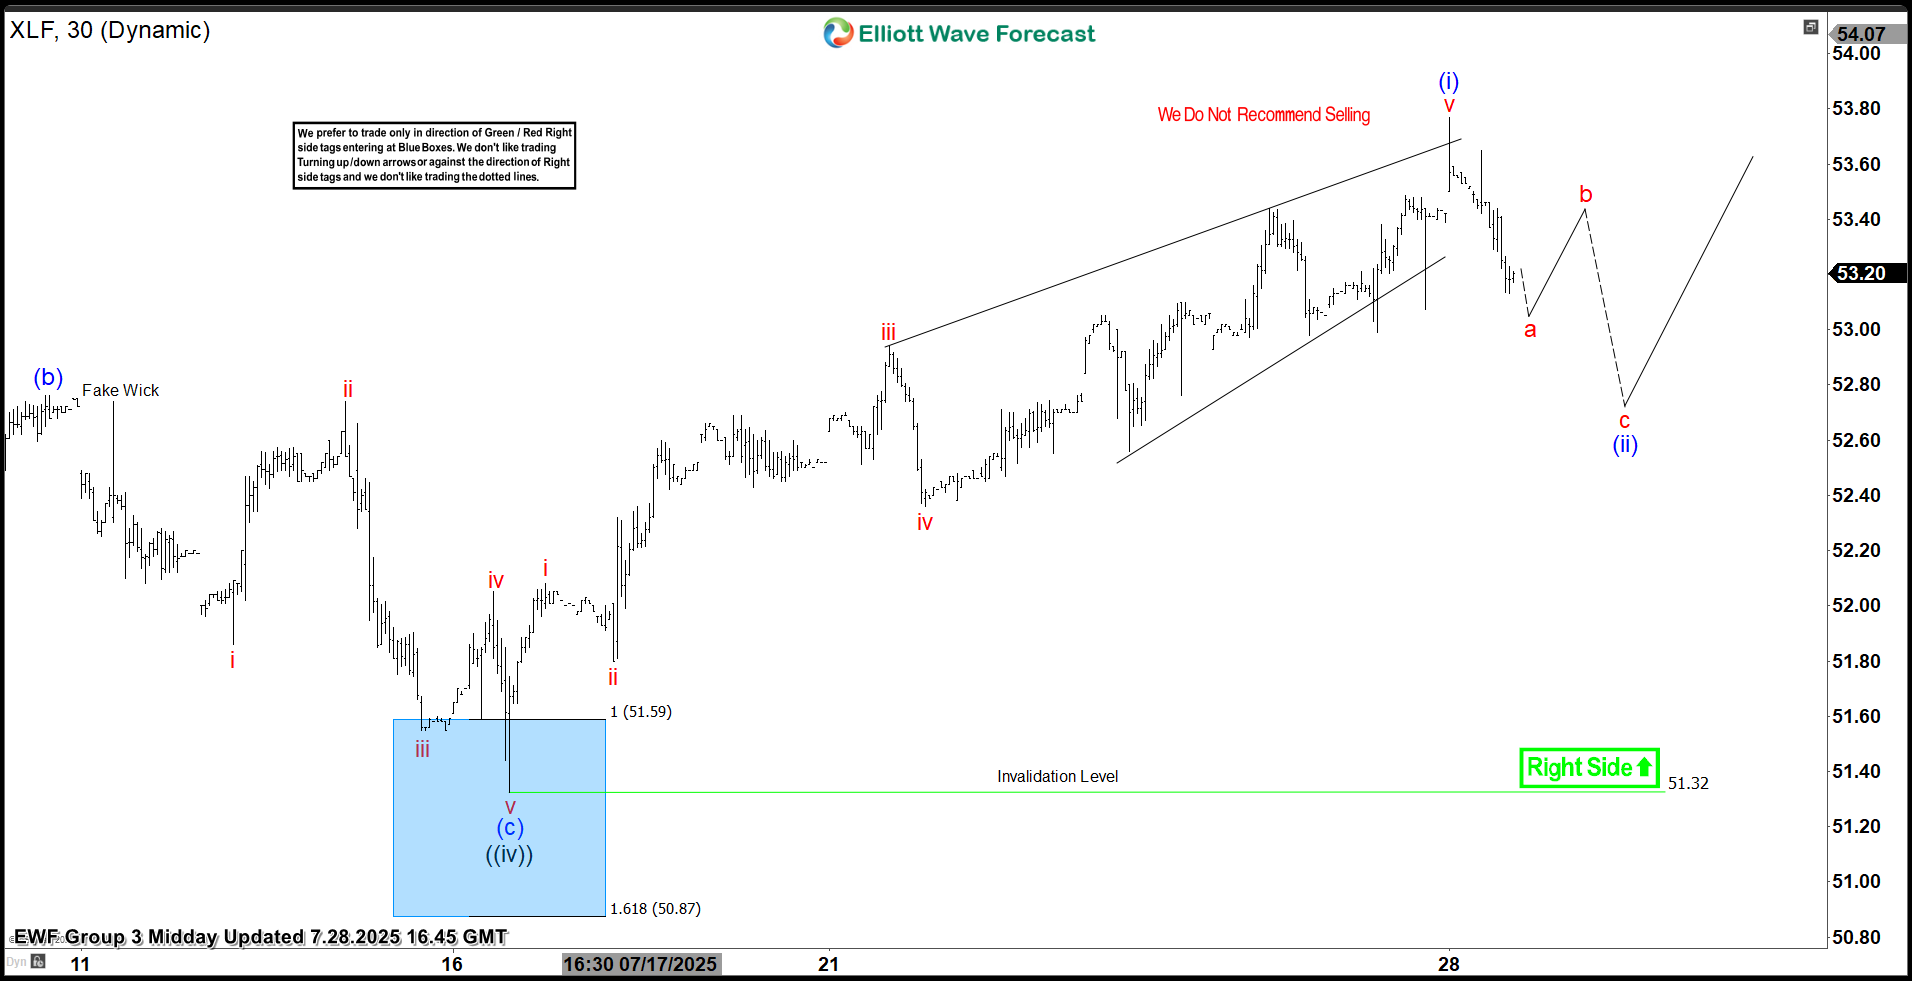
This is the 1-hour Elliott wave Chart from the 7.28.2025 Midday update. In which the ETF is showing a reaction higher taking place, right after ending the double correction within the blue box area. Allowed members to create a risk-free position shortly after taking the long position at the blue box area. Since then, XLF has already made a new high targeting $53.78- $54.54 area higher minimum before profit taking & next pullback takes place in 3, 7 or 11 swings.
Peringatan: Pendapat yang disampaikan sepenuhnya merupakan milik penulis dan tidak mencerminkan posisi resmi Followme. Followme tidak bertanggung jawab atas keakuratan, kelengkapan, atau keandalan informasi yang disediakan, serta tidak bertanggung jawab atas tindakan apa pun yang diambil berdasarkan konten ini, kecuali dinyatakan secara tertulis.
 Belum ada komentar. Jadil yang pertama untuk membagikan komentar.