Shares of McDonald’s Corp., the largest fast-food chain, are trading at 292.00.
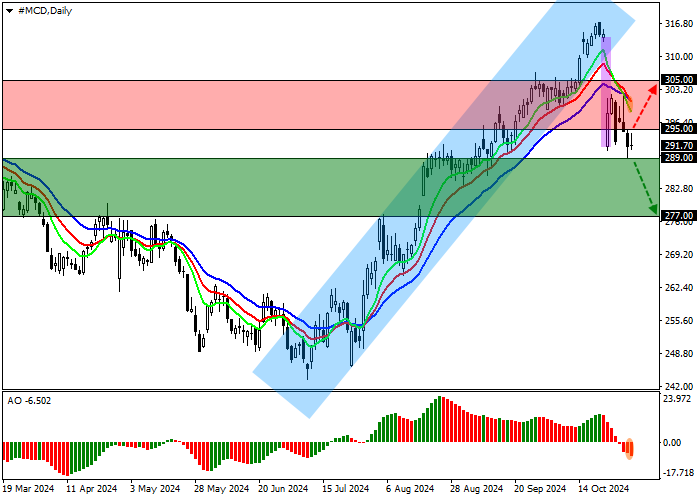
On the daily chart, the price is moving away from the support line of the ascending channel 315.00–300.00, forming a full-fledged downward correction.
On the four-hour chart, the negative dynamics may continue since the exit from the range was with a price gap of 314.00–291.00, which may not be covered. In addition, the quotes have consolidated below the previous low of 292.00, and now there are almost no obstacles to a decline.
Technical indicators are strengthening the sell signal: fast EMAs on the Alligator indicator have crossed the signal line downwards, and the AO oscillator histogram is forming downward bars, approaching the transition level.

Trading tips
Short positions may be opened after the price declines and consolidates below 289.00, with the target at 277.00. Stop loss is 295.00. Implementation period: 7 days or more.
Long positions may be opened after the price grows and consolidates above 295.00, with the target at 305.00. Stop loss is 290.00.



 Belum ada komentar. Jadi orang pertama yang membagikan komentar.