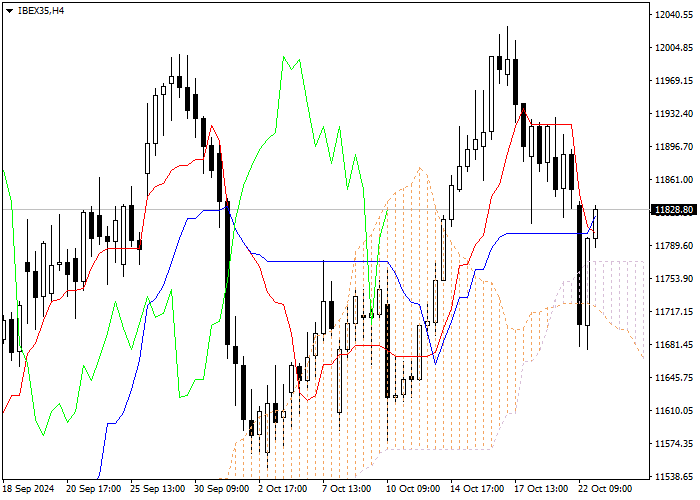
Let's look at the four-hour chart. Tenkan-sen and Kijun-sen lines have merged, the lines are horizontal . Confirmative line Chikou Span is above the price chart, current cloud has reversed from descending to ascending. The instrument has been corrected to the Tenkan-sen line. The closest support level is the lower border of the cloud (11786.53). One of the previous maximums of Chikou Span line is expected to be a resistance level (11891.77).
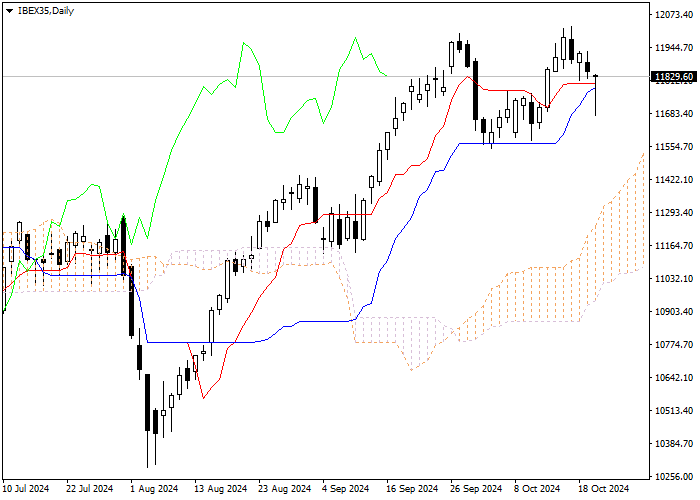
On the daily chart Tenkan-sen and Kijun-sen lines have merged, the lines are horizontal . Confirmative line Chikou Span is above the price chart, current cloud is ascending. The instrument is trading below Tenkan-sen and Kijun-sen lines; the Bearish trend is still strong. The closest support level is Tenkan-sen line (11797.93). One of the previous maximums of Chikou Span line is expected to be a resistance level (11922.86).
It is recommended to open long positions at current price with Take Profit at the level of previous maximum of Chikou Span (11922.86) line and Stop Loss at the level of Kijun-sen line (11797.93).
Peringatan: Pendapat yang disampaikan sepenuhnya merupakan milik penulis dan tidak mencerminkan posisi resmi Followme. Followme tidak bertanggung jawab atas keakuratan, kelengkapan, atau keandalan informasi yang disediakan, serta tidak bertanggung jawab atas tindakan apa pun yang diambil berdasarkan konten ini, kecuali dinyatakan secara tertulis.
Suka artikel ini? Tunjukkan apresiasimu dengan memberi hadiah untuk penulis.
Balasan 0
Terpopuler
Belum ada komentar.Jadil yang pertama untuk membagikan komentar.



 Belum ada komentar. Jadil yang pertama untuk membagikan komentar.