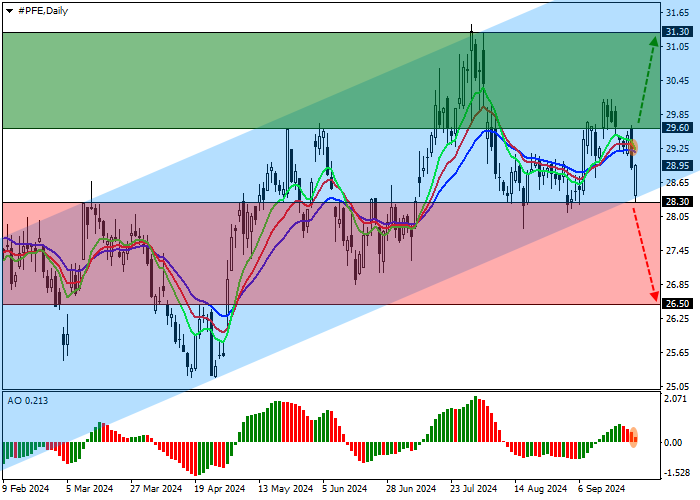
Shares of Pfizer Inc., the largest American pharmaceutical company, are correcting at 29.00.
On the daily chart, the price is above the support line of the ascending channel with dynamic boundaries of 31.70–28.00, moving away from it.
On the four-hour chart, the quotes could not leave the range and reversed at the support level of 28.00. After consolidating above 30.00, the asset may reach the annual high of 31.50. However, in the event of a return to the 28.00 area, negative dynamics may develop.
Technical indicators do not provide a stable signal: fast EMAs on the Alligator indicator are above the signal line, and the AO histogram forms correction bars above the transition level.

Trading tips
Long positions may be opened after the price rises and consolidates above 29.60, with the target at 31.30. Stop loss is 29.20. Implementation period: 7 days or more.
Short positions may be opened after the price falls and consolidates below 28.30, with the target at 26.50. Stop loss is 29.00.



 Belum ada komentar. Jadil yang pertama untuk membagikan komentar.