Shares of Altria Group Inc., one of the leaders in the tobacco market, are correcting at 50.00.
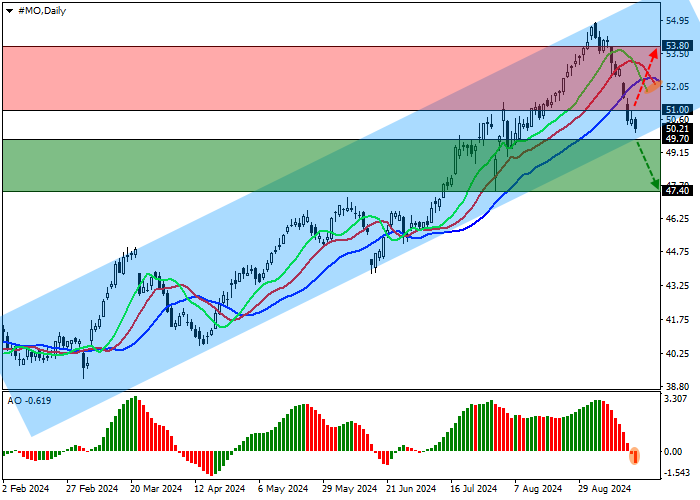
On the daily chart, the price is falling within the next wave inside the ascending channel with dynamic boundaries of 55.00–50.00.
On the four-hour chart, the asset has not yet indicated an attempt to leave the range, holding above the resistance line of 50.20. After consolidation below the low of 49.50, the channel will begin to be implemented, and a deeper decline may follow after consolidation below 48.00.
Technical indicators have formed a sell signal: the EMA fluctuation range on the Alligator indicator is quite wide and directed downwards, and the AO histogram forms downward bars in the sell zone.
Trading tips
Short positions may be opened after the price declines and consolidates below 49.70, with the target at 47.40. Stop loss is 50.70. Implementation period: 7 days or more.
Long positions may be opened after the price grows and consolidates above 51.00, with the target at 53.80. Stop loss is 50.00.



 Belum ada komentar. Jadil yang pertama untuk membagikan komentar.