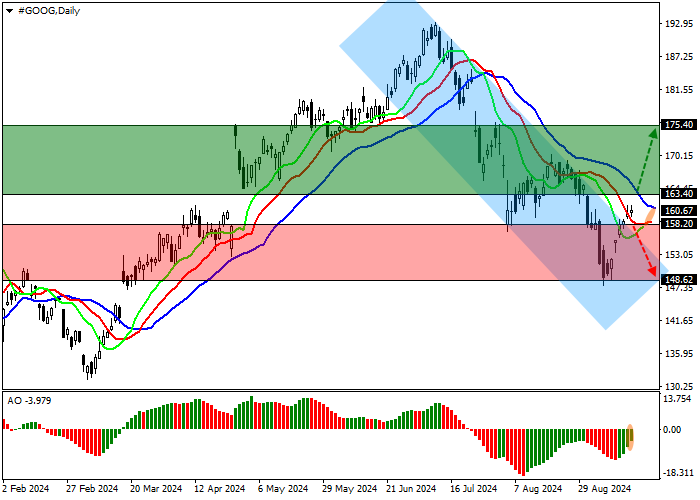
Shares of US public company Alphabet Inc. were trading at 161.00.
On the daily chart, a correction trend is forming, within this range the price is trying to leave the downtrend channel 160.00–148.00.
On the H4 chart, the price has left the channel, breaking above the resistance line at 159.50, if it consolidates above the high since August 26 at 169.00, the next target will be 175.40.
Technical indicators are delaying the sell signal: fast EMAs on the "Alligator" indicator are approaching the signal line, and the AO histogram is forming bullish bars below the transition level.

Trading scenarios
It is possible to open buy orders, after the price rises and consolidates above the level of 163.40 with profit targets at 175.40. Stop loss — below the level of 160.00. Implementation period: 7 days or more.
It is possible to consider opening short positions, after the price falls and consolidates below 158.20, with the target to take profit at 148.60. Stop loss — 161.00.



 Belum ada komentar. Jadil yang pertama untuk membagikan komentar.