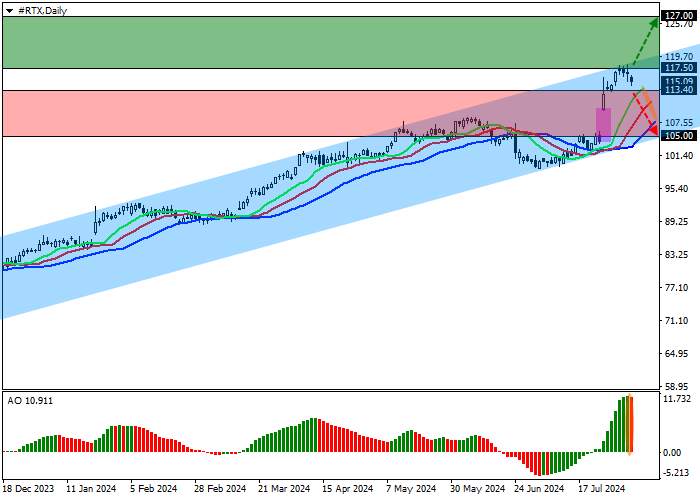
The shares of RTX Corp., an American aerospace and defense conglomerate, are trading at 115.00.
On the daily chart, the price is correcting upwards, holding below the resistance line of the ascending channel 120.00–104.00.
On the four-hour chart, this movement has turned into a trend, confirmed by the recent price gap of 109.70–104.00, which wasn’t worked out. The target for the trend may be an exit from the channel with the quotes consolidation above 118.00.
Technical indicators are holding the buy signal: the fast EMA on the Alligator indicator are above the signal line, and the AO histogram is forming correction bars in the buy zone.
Trading tips
Long positions may be opened after the price grows and consolidates above the 117.50 level, with the target at 127.00. Stop loss — 114.00. Implementation period: 7 days or more.
Short positions may be opened after the price declines and consolidates below 113.40, with the target at 105.00. Stop loss — 116.00.


Tinggalkan pesan Anda sekarang