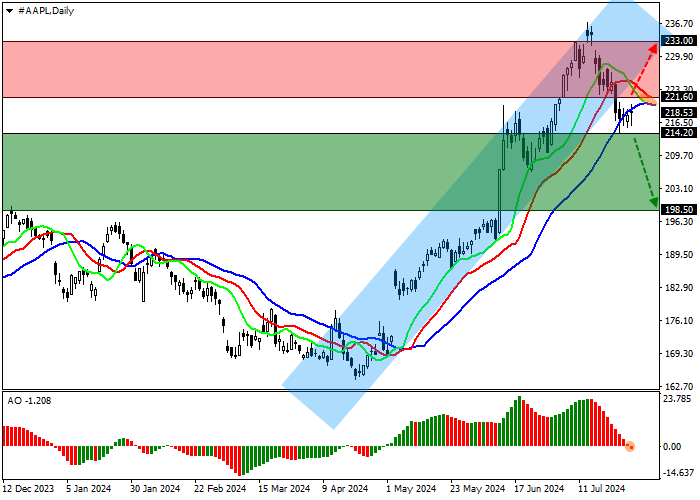
Shares of Apple Inc., a giant in the development and sale of personal and tablet computers, are moving in a correction trend at 218.00.
On the daily chart, the price left the global ascending channel 233.00–220.00 and is retreating from the support line.
On the four-hour chart, the negative dynamics may continue as the quotes have overcome the high of 220.00, and now the nearest obstacle is the support level of 198.00.
Technical indicators confirm the likelihood of a continued decline: fast EMA on the Alligator indicator strengthen the sell signal, and the AO histogram forms downward bars below the transition level.
Trading tips
Short positions may be opened after the price declines and consolidates below 214.20, with the target at 198.50. Stop loss is above 220.00. Implementation period: 7 days or more.
Long positions may be opened after the price grows and consolidates above 221.60, with the target at 233.00 and stop loss 216.00.
Peringatan: Pendapat yang disampaikan sepenuhnya merupakan milik penulis dan tidak mencerminkan posisi resmi Followme. Followme tidak bertanggung jawab atas keakuratan, kelengkapan, atau keandalan informasi yang disediakan, serta tidak bertanggung jawab atas tindakan apa pun yang diambil berdasarkan konten ini, kecuali dinyatakan secara tertulis.
Suka artikel ini? Tunjukkan apresiasimu dengan memberi hadiah untuk penulis.
Balasan 0
Terpopuler
Belum ada komentar.Jadil yang pertama untuk membagikan komentar.



 Belum ada komentar. Jadil yang pertama untuk membagikan komentar.