Shares of Alcoa Corp., one of the largest aluminum producers, are correcting at 33.00.
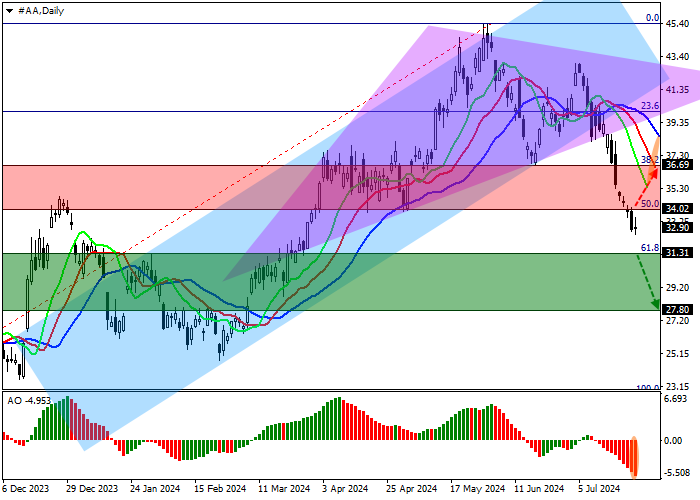
On the daily chart, the price is retreating from the lower border of the ascending channel with dynamic boundaries of 46.00–39.00.
On the four-hour chart, the probability of a decline remains high. After a consolidation below the low of 34.00, the price may reach the full Fibonacci correction level of 61.8% at 27.80. However, after a reversal, growth, and consolidation above the intermediate Fibonacci correction level of 50.0% at 34.00, an increase to the low of June 18 36.70 may follow.
Technical indicators are holding the sell signal: the EMA oscillation range on the Alligator indicator is expanding downwards, and the AO histogram is forming downward bars in the sell zone.
Trading tips
Short positions may be opened after the price declines and consolidates below 31.31, with the target at 27.80. Stop loss is 33.00. Implementation period: 7 days or more.
Long positions may be opened after the price grows and consolidates above 34.00, with the target at 36.69. Stop loss is 33.00.



 Belum ada komentar. Jadil yang pertama untuk membagikan komentar.