Current trend
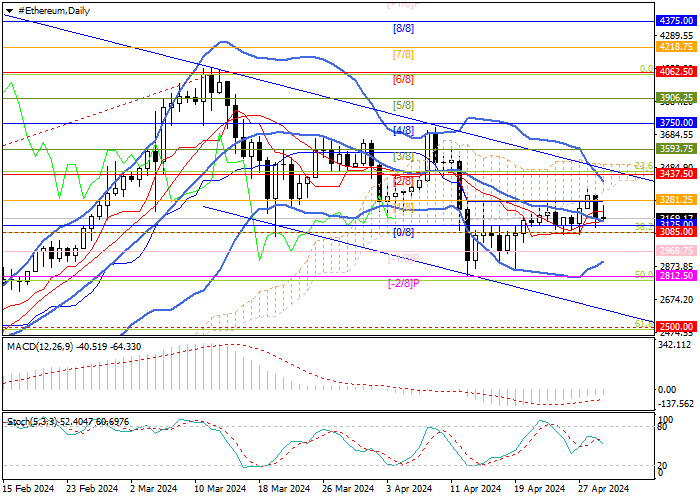
The ETH/USD pair has formed a wide downward channel and is correcting down to the long-term uptrend for the second month in a row. Currently, the price has consolidated above the center line of Bollinger Bands and is close to the key level for the "bulls" at 3437.50 (Fibonacci retracement 23.6%, Murrey level [2/8]), the breakout of which will allow it to leave the downward channel and continue growth towards the targets 3750.00 (Murrey level [4/8]) and 4062.50 (Murrey level [1/8], area of annual highs).
Technical indicators confirm the preservation of the midterm downtrend: Bollinger Bands and Stochastic are reversing downwards, and MACD histogram is stable in the negative zone. Under these conditions, the most likely is the resumption of a decline in quotes with a breakdown of the center line of Bollinger Bands and the support zone 3125.00–3085.00 (Fibonacci retracement 50.0%, Murrey level [1/8]), the targets of which could be 2187.50 (Murrey level [- 2/8], Fibonacci retracement 50.0%) and 2500.00 (Fibonacci retracement 61.8%).
Support and resistance
Resistance levels: 3437.50, 3750.00, 4062.50.
Support levels: 3085.00, 2812.50, 2500.00.
Trading tips
Short positions could be opened below 3085.00 with targets at 2812.50, 2500.00 and stop-loss at 3280.00. Implementation period: 5-7 days.
Long positions may be opened above 3437.50 with targets at 3750.00, 4062.50 and stop-loss at 3250.00.



 Belum ada komentar. Jadil yang pertama untuk membagikan komentar.