Shares of Starbucks Corp., one of the largest companies that owns the coffee chain of the same name, are trading at 88.00.
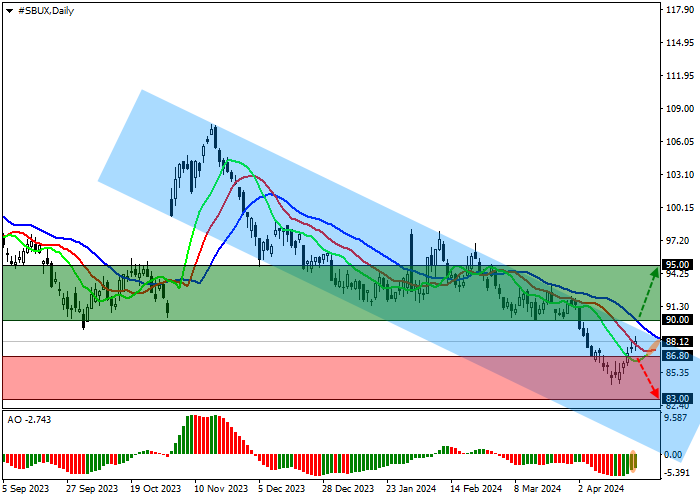
On the daily chart, the price is approaching the resistance line of the downward channel 90.00–81.00, forming a growth wave.
On the four-hour chart, after renewing the annual low of 84.00, the quotes reversed upwards. If the asset consolidates above the autumn low of 90.00, the potential for upward dynamics will significantly increase.
Technical indicators are weakening the sell signal: fast EMA on the Alligator indicator are approaching the signal line, narrowing the range of fluctuations, and the AO histogram is forming corrective bars in the sales zone.
Trading tips
Long positions may be opened after the price rises and consolidates above 90.00, with the target at 95.00. Stop loss – 87.00. Implementation period: 7 days or more.
Short positions may be opened after the price declines and consolidates below 86.80, with the target at 83.00. Stop loss – 89.00.



 Belum ada komentar. Jadil yang pertama untuk membagikan komentar.