The price is in a correction and a fall is possible.
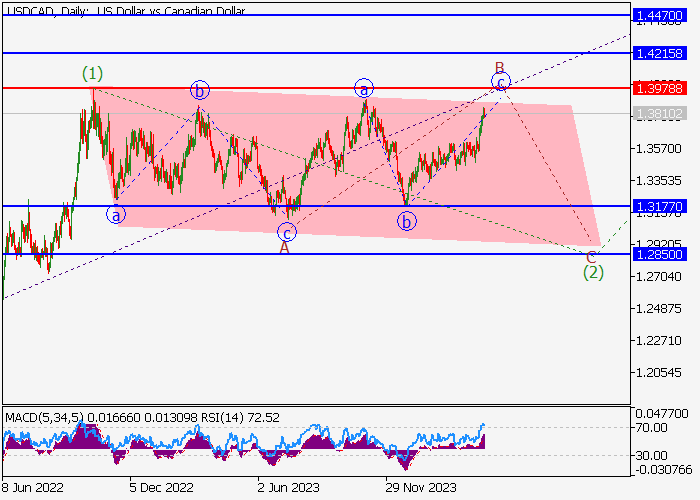
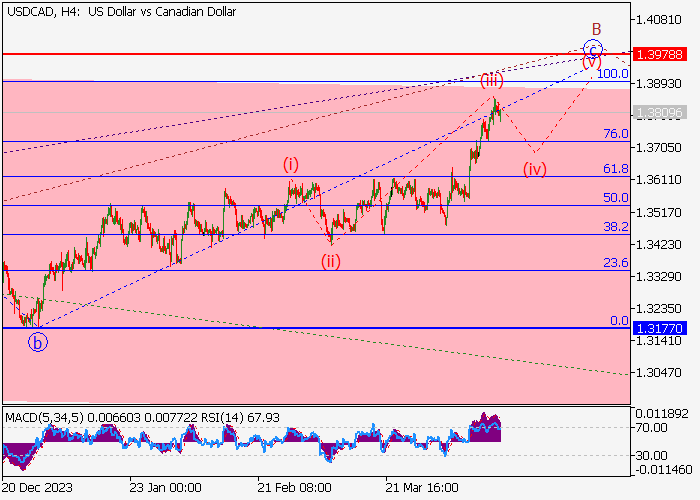
On the daily chart, the upward first wave of the higher level (1) of 5 ended, and a correction develops as the second wave (2) of 5, within which the wave B of (2) formed. Now, the wave c of B is developing, within which the wave (iii) of c of B has ended. If the assumption is correct, after the wave B of (2) the price will fall within the wave C of (2) to the area of 1.3177–1.2850. In this scenario, critical stop loss level is 1.3978.
Main scenario
Short positions will become relevant below the level of 1.3978 with the targets at 1.3177–1.2850. Implementation period: 7 days and more.
Alternative scenario
A breakout and the consolidation of the price above the level of 1.3978 will let the asset grow to the area of 1.4215–1.4470.
Peringatan: Pendapat yang disampaikan sepenuhnya merupakan milik penulis dan tidak mencerminkan posisi resmi Followme. Followme tidak bertanggung jawab atas keakuratan, kelengkapan, atau keandalan informasi yang disediakan, serta tidak bertanggung jawab atas tindakan apa pun yang diambil berdasarkan konten ini, kecuali dinyatakan secara tertulis.
Suka artikel ini? Tunjukkan apresiasimu dengan memberi hadiah untuk penulis.
Balasan 0
Terpopuler
Belum ada komentar.Jadil yang pertama untuk membagikan komentar.



 Belum ada komentar. Jadil yang pertama untuk membagikan komentar.