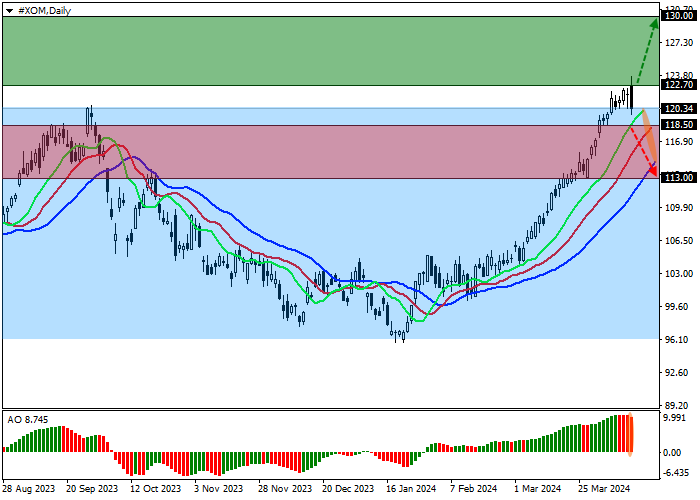
Shares of ExxonMobil Corp., an American oil company, are trading in a corrective trend near the level of 120.00.
On the daily chart, the price is trying to leave the sideways channel of 120.00–96.00, breaking the resistance line.
On the four-hour chart, the quotes complete a reverse test of the resistance line of 120.00, after which growth may continue. A decrease is possible only if the resistance level and the high of September 20, 119.00, are broken again, with the target at the support level of 110.00.
Technical indicators are holding a buy signal: fast EMA on the Alligator indicator are above the signal line, and the AO histogram is forming ascending bars in the positive zone.
Trading tips
Long positions may be opened after the price rises and consolidates above 122.70, with the target at 130.00. Stop loss is around 120.00. Implementation period: 7 days or more.
Short positions may be opened after the price declines and consolidates below 118.50, with the target at 113.00. Stop loss – 121.00.



 Belum ada komentar. Jadil yang pertama untuk membagikan komentar.