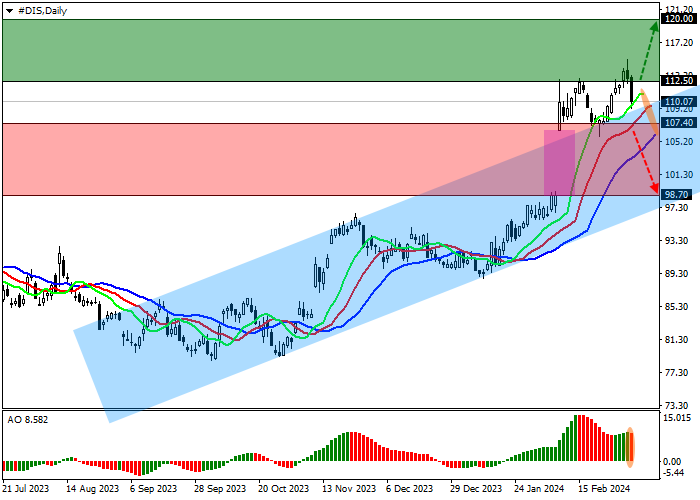
Shares of The Walt Disney Co., one of the leaders in the entertainment industry, are trading in a corrective trend at 110.00.
On the daily chart, the price, having left the local ascending channel with dynamic boundaries of 107.00–96.00, is trying to stay above it, testing the passed resistance line for the second time.
The four-hour chart shows that after the test, growth is likely to continue, however, if the quotes return into the channel, the recent price gap of 106.00–98.70 may be implemented.
Technical indicators hold a buy signal: fast EMAs on the Alligator indicator move away from the signal line, and the AO histogram forms corrective bars, increasing in the buy zone.
Trading tips
Long positions may be opened after the price rises and consolidates above 112.50 with the target at 120.00. Stop loss – 110.00. Implementation period: 7 days or more.
Short positions may be opened after the price declines and consolidates below 107.40 with the target at 98.70. Stop loss – 110.00.


Tinggalkan pesan Anda sekarang