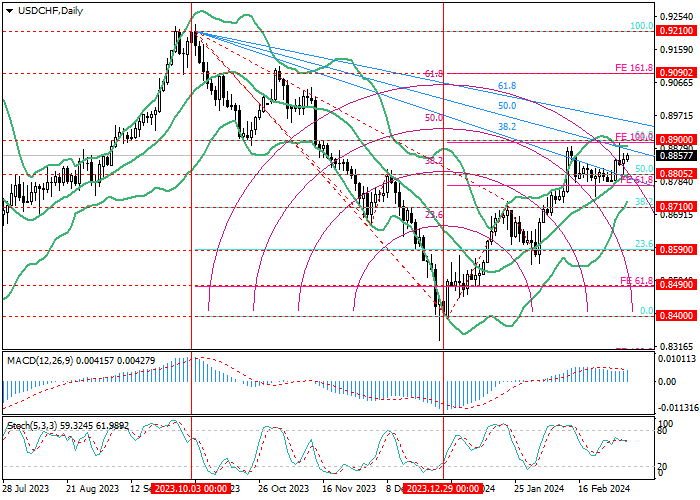
USD/CHF, D1
On the daily chart, the price is rising for the third month: after a reversal at 0.8400 (0.0% correction), it breaks through a downward fan to 0.8900 (61.8% correction), after which it may reach the area of 0.9090 (161.8% expansion) and 0.9210 (100.0% correction). After a breakout of the key “bearish” level of 0.8710 (correction of 38.2%, lower line of Bollinger bands), the quotes may return to the area of 0.8590 (correction of 23.6%) and 0.8490 (extension of 61.8%).
Technical indicators do not give a single signal: Bollinger Bands are directed upwards, the MACD histogram is stable in the positive zone but Stochastic is reversing downwards.

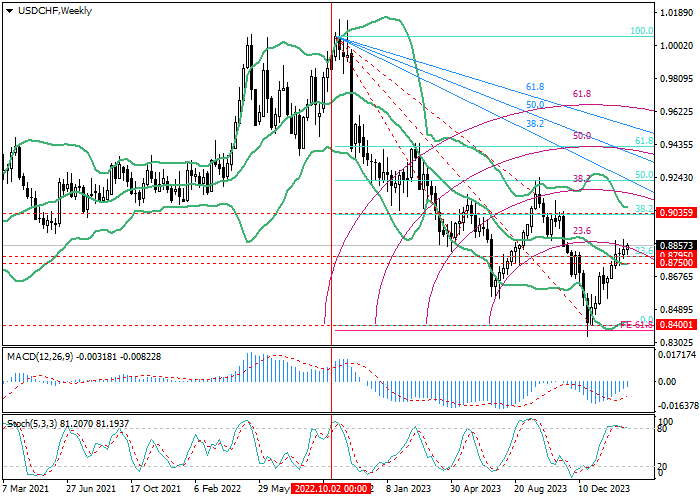
USD/CHF, W1
On the weekly chart, the asset reversed at 0.8400 (0.0% correction), resumed growth, and consolidated above 0.8795 (23.6% correction, middle line of Bollinger Bands), which allows reaching 0.9035 (38.2% correction). With a reverse breakdown of 0.8795 (23.6% correction, middle line of Bollinger bands), the quotes may return to the initial growth point of 0.8400.
Technical indicators do not give a single signal: Bollinger Bands are pointing downwards, the MACD histogram is entering the positive area, and Stochastic is preparing to leave the overbought zone.
Support and resistance
Continuation of the upward dynamics seems more likely: if the level 0.8900 (correction 61.8%, D1) is broken upward, its targets will be 0.9035 (correction 38.2%, W1) and 0.9210 (correction 100.0%, D1). However, if 0.8710 (correction of 38.2%, D1) is broken, a decrease to the area of 0.8590 (correction of 23.6%, D1), 0.8490 (extension of 61.8%, D1), and 0.8400 (correction of 0.0%, D1, W1) is expected.
Resistance levels: 0.8900, 0.9035, 0.9210.
Support levels: 0.8710, 0.8590, 0.8490, 0.8400.
Trading tips
Long positions may be opened above 0.8900, with the targets at 0.9035, 0.9210 and stop loss 0.8830. Implementation time: 5–7 days.
Short positions may be opened below 0.8710, with the targets at 0.8590, 0.8490, 0.8400, and stop loss 0.8790.

Tinggalkan pesan Anda sekarang