


| Scenario | |
|---|---|
| Timeframe | Weekly |
| Recommendation | BUY STOP |
| Entry Point | 7470.5 |
| Take Profit | 7650.0 |
| Stop Loss | 7400.0 |
| Key Levels | 7200.0, 7340.0, 7470.0, 7650.0 |
| Alternative scenario | |
|---|---|
| Recommendation | SELL STOP |
| Entry Point | 7339.5 |
| Take Profit | 7200.0 |
| Stop Loss | 7400.0 |
| Key Levels | 7200.0, 7340.0, 7470.0, 7650.0 |
Current trend
The leading index of the London Stock Exchange FTSE 100 shows corrective dynamics at around 7409.0.
The publishing period for component companies has ended, but the index is down more than 6.0% from its high in early August. The key obstacles to the growth of the stock market are still the bond market and weak macroeconomic statistics.
Late last week, the Confederation of British Industry (CBI) reported that retail sales were -44.0 points after -25.0 points last year, with expectations for August at -21.0 points. British retailers predict that against the backdrop of continuing interest rate hikes and weak demand, the volume of investment in production will decrease, which will lead to a drop in sales. According to the latest CBI report, the retail sentiment index fell to a year low of -14.0 points, while in May it was 6.0 points.
Another reason for the weak dynamics of the stock market is the high yield of bonds, where local growth is observed today: 10-year bonds are trading at 4.486%, up 0.89% from yesterday's close, 20-year bonds are traded at 4.722%, up 1.04%, and 30-year bonds are holding slightly below the key yield level of 4.680%, up 0.91% since the start of trading.
The growth leaders in the index are Tesco Plc. ( 1.92%), Smurfit Kappa Group Plc. ( 1.81%), Melrose Industries Plc. ( 1.40%), Intertek Group Plc. ( 1.37%).
Among the leaders of the decline are Pennon Group Plc. (-2.81%), Fresnillo Plc. (-2.14%), International Consolidated Airlines Group S.A. (-1.56%).
Support and resistance
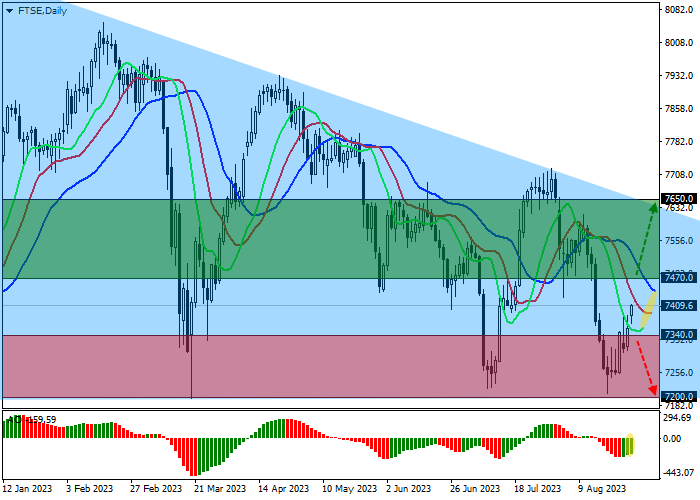
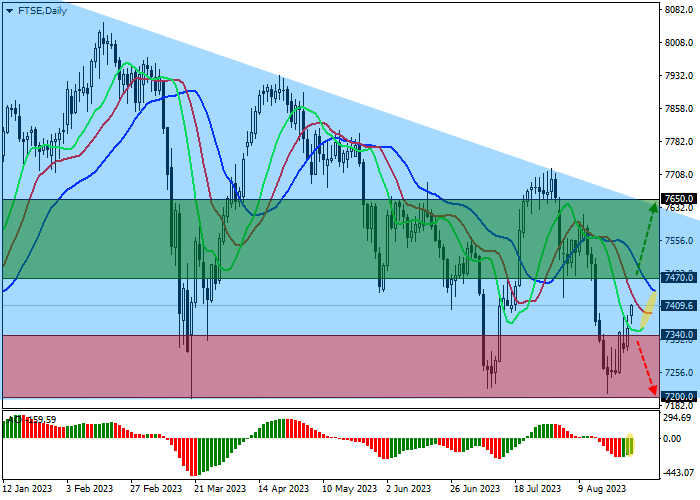
On the daily chart, the index quotes continue their local correction, rising towards the resistance line of the global Triangle pattern at around 7650.0.
Technical indicators are in the state of a sell signal, but weaken it: the fluctuation range of the Alligator indicator EMAs began to actively narrow, and the histogram of the AO oscillator is forming new corrective bars, rising in the sell zone.
Support levels: 7340.0, 7200.0.
Resistance levels: 7470.0, 7650.0.
Trading tips
If the asset continues growing, and the price consolidates above the local resistance at 7470.0, long positions with a target of 7650.0 and stop-loss of 7400.0 will be relevant. Implementation time: 7 days and more.
If the asset continues declining and the price consolidates below 7340.0, short positions can be opened with the target at 7200.0. Stop-loss — 7400.0.
Peringatan: Pendapat yang disampaikan sepenuhnya merupakan milik penulis dan tidak mencerminkan posisi resmi Followme. Followme tidak bertanggung jawab atas keakuratan, kelengkapan, atau keandalan informasi yang disediakan, serta tidak bertanggung jawab atas tindakan apa pun yang diambil berdasarkan konten ini, kecuali dinyatakan secara tertulis.
 Belum ada komentar. Jadil yang pertama untuk membagikan komentar.