


| Scenario | |
|---|---|
| Timeframe | Intraday |
| Recommendation | BUY |
| Entry Point | 0.0633 |
| Take Profit | 0.0754 |
| Stop Loss | 0.0593 |
| Key Levels | 0.0572, 0.0593, 0.0754, 0.0814 |
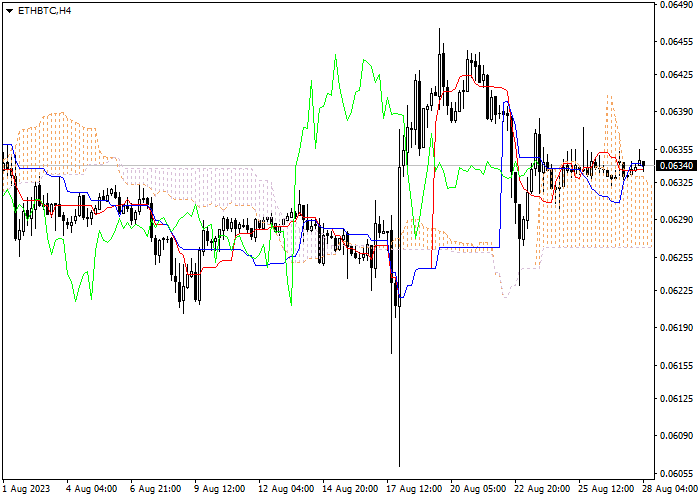
Let's look at the four-hour chart. Tenkan-sen line is below Kijun-sen, the blue line is directed downwards, while the red one remains horizontal. Confirmative line Chikou Span is approaching the price chart from below, current cloud is ascending. The instrument is trading between Tenkan-sen and Kijun-sen lines. One of the previous minimums of Chikou Span line is expected to be a support level (0.0593). One of the previous maximums of Chikou Span line is expected to be a resistance level (0.0754).
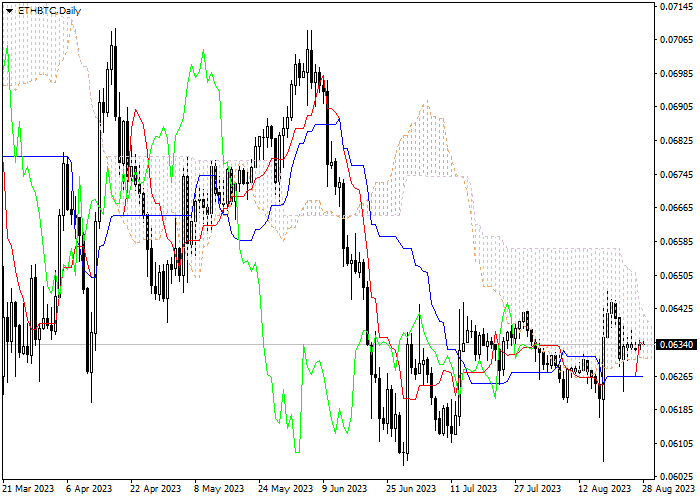
On the daily chart Tenkan-sen line is above Kijun-sen, the red line is directed downwards, while the blue one remains horizontal. Confirmative line Chikou Span is below the price chart, current cloud is descending. The instrument is trading between Tenkan-sen and Kijun-sen lines. One of the previous minimums of Chikou Span line is expected to be a support level (0.0572). One of the previous maximums of Chikou Span line is expected to be a resistance level (0.0814).
It is recommended to open long positions at current price with Take Profit at the level of previous maximum of Chikou Span (0.0754) line and Stop Loss at the level of Kijun-sen line (0.0593).
Peringatan: Pendapat yang disampaikan sepenuhnya merupakan milik penulis dan tidak mencerminkan posisi resmi Followme. Followme tidak bertanggung jawab atas keakuratan, kelengkapan, atau keandalan informasi yang disediakan, serta tidak bertanggung jawab atas tindakan apa pun yang diambil berdasarkan konten ini, kecuali dinyatakan secara tertulis.
 Belum ada komentar. Jadil yang pertama untuk membagikan komentar.
