


| Scenario | |
|---|---|
| Timeframe | Weekly |
| Recommendation | SELL STOP |
| Entry Point | 1867.0 |
| Take Profit | 1806.0 |
| Stop Loss | 1900.0 |
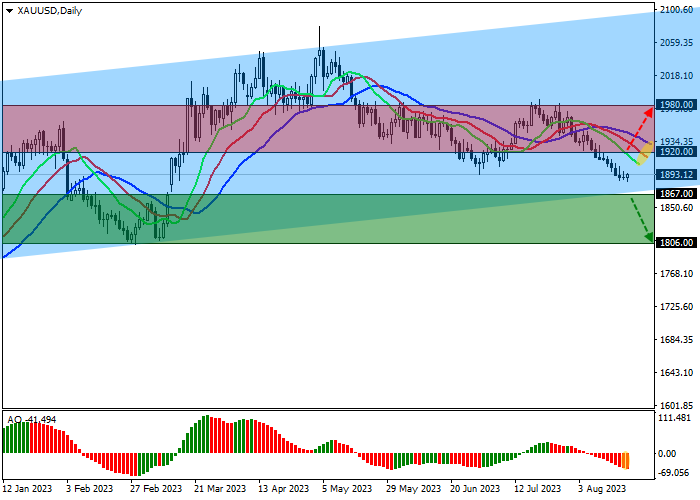
| Key Levels | 1806.0, 1867.0, 1920.0, 1980.0 |
| Alternative scenario | |
|---|---|
| Recommendation | BUY STOP |
| Entry Point | 1920.0 |
| Take Profit | 1980.0 |
| Stop Loss | 1900.0 |
| Key Levels | 1806.0, 1867.0, 1920.0, 1980.0 |
Current trend
In the precious metals market, there is a protracted correction associated with a drop in demand for real assets against a correction in bond yields, and the XAU/USD pair is correcting in a sideways trend around 1893.0. For some time, experts believed that the indicator would not be able to approach the peak values of autumn 2022 but now for popular 10-year securities, it has exceeded the high of October 16, 2002, of 4.202%, reaching 4.290%.
According to the latest reports on the positions of traders in the derivatives market, investment demand for the asset this month remains almost unchanged, confirming a local correction. According to the Chicago Mercantile Exchange (CME Group) since August 10, the average position in gold has been 234.300K contracts, which is significantly lower than the mid-July statistics of 380.400K contracts. while, on Thursday it was at 66.540K transactions. Thus, the most likely scenario would be a continuation of a sideways correction or a moderate decline in the XAU/USD pair since the current demand is not enough to strengthen the upward dynamics.
Support and resistance
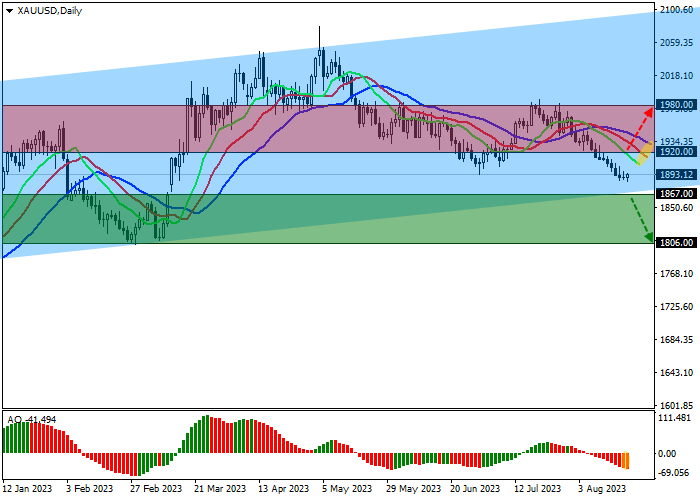
On the daily chart, the price is trying to leave the global ascending channel with dynamic boundaries 2100.0–1870.0, holding above the support line.
Technical indicators strengthen the sell signal: fast EMAs on the Alligator indicator are below the signal line, expanding the range of fluctuations, and the AO histogram forms down bars below the transition level.
Resistance levels: 1920.0, 1980.0.
Support levels: 1867.0, 1806.0.
Trading tips
Short positions may be opened after the price drops and consolidates below 1867.0 with the target at 1806.0. Stop loss – 1900.0. Implementation period: 7 days or more.
Long positions may be opened after the price rises and consolidates above 1920.0 with the target at 1980.0. Stop loss – 1900.0.
Peringatan: Pendapat yang disampaikan sepenuhnya merupakan milik penulis dan tidak mencerminkan posisi resmi Followme. Followme tidak bertanggung jawab atas keakuratan, kelengkapan, atau keandalan informasi yang disediakan, serta tidak bertanggung jawab atas tindakan apa pun yang diambil berdasarkan konten ini, kecuali dinyatakan secara tertulis.
 Belum ada komentar. Jadil yang pertama untuk membagikan komentar.