


| Scenario | |
|---|---|
| Timeframe | Weekly |
| Recommendation | SELL STOP |
| Entry Point | 244.00 |
| Take Profit | 214.00 |
| Stop Loss | 255.00 |
| Key Levels | 244.00, 250.00, 253.00, 255.00, 258.00, 298.00 |
| Alternative scenario | |
|---|---|
| Recommendation | BUY STOP |
| Entry Point | 264.00 |
| Take Profit | 284.00 |
| Stop Loss | 258.00 |
| Key Levels | 244.00, 250.00, 253.00, 255.00, 258.00, 298.00 |
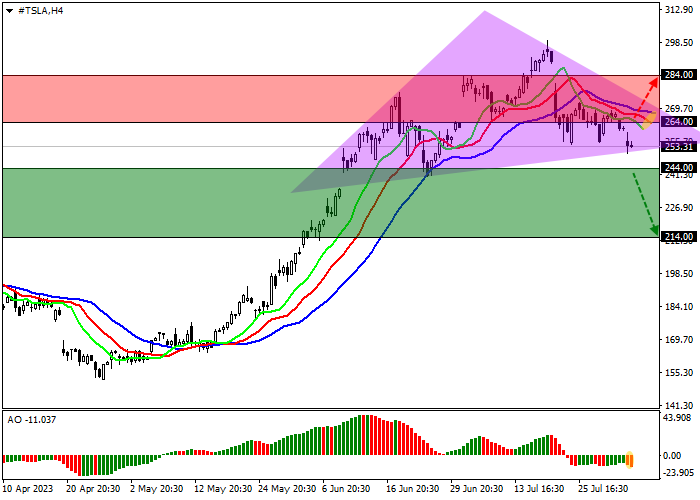
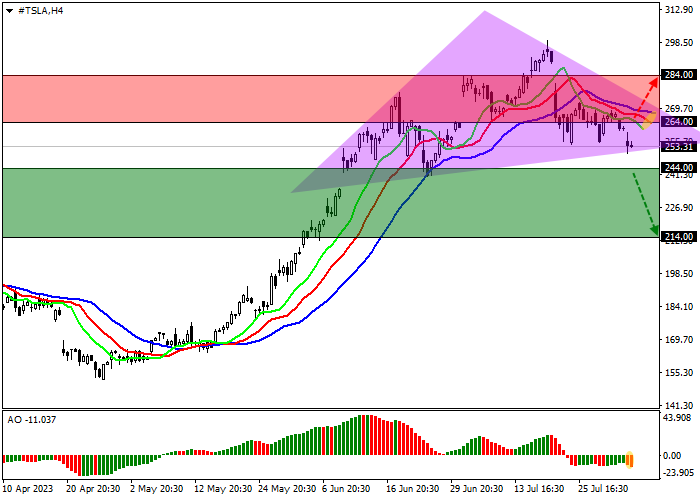
Shares of Tesla Inc., the world’s leading manufacturer of electric cars, are correcting at 253.00.
On the daily chart, the price is starting to decline from the year’s high of 298.00.
On the four-hour chart, a local reversal Head and shoulders pattern with the Neckline at 250.00 formed. A consolidation below the June 26 low at 244.00 will increase the negative momentum.
Technical indicators confirm the development of negative dynamics: fast EMAs on the Alligator indicator are moving away from the signal line, expanding the fluctuation range, and the AO histogram is forming downward bars in the sell zone.
Trading tips
Short positions may be opened after a reversal, reduction, and consolidation of the price below 244.00 with the target at 214.00. Stop loss – 255.00. Implementation period: 7 days or more.
Long positions may be opened after the price rises and consolidates above 264.00 with the target at 284.00. Stop loss – 258.00.
Peringatan: Pendapat yang disampaikan sepenuhnya merupakan milik penulis dan tidak mencerminkan posisi resmi Followme. Followme tidak bertanggung jawab atas keakuratan, kelengkapan, atau keandalan informasi yang disediakan, serta tidak bertanggung jawab atas tindakan apa pun yang diambil berdasarkan konten ini, kecuali dinyatakan secara tertulis.
 Belum ada komentar. Jadil yang pertama untuk membagikan komentar.