


| Scenario | |
|---|---|
| Timeframe | Weekly |
| Recommendation | BUY STOP |
| Entry Point | 156.30 |
| Take Profit | 159.38, 162.50 |
| Stop Loss | 154.00 |
| Key Levels | 150.00, 153.12, 156.25, 159.38, 162.50 |
| Alternative scenario | |
|---|---|
| Recommendation | SELL STOP |
| Entry Point | 153.10 |
| Take Profit | 150.00 |
| Stop Loss | 155.30 |
| Key Levels | 150.00, 153.12, 156.25, 159.38, 162.50 |
Current trend
Shares of Walmart Inc., an American company that manages the world's largest wholesale and retail chain, continue to trade within the framework of a mid-term upward trend.
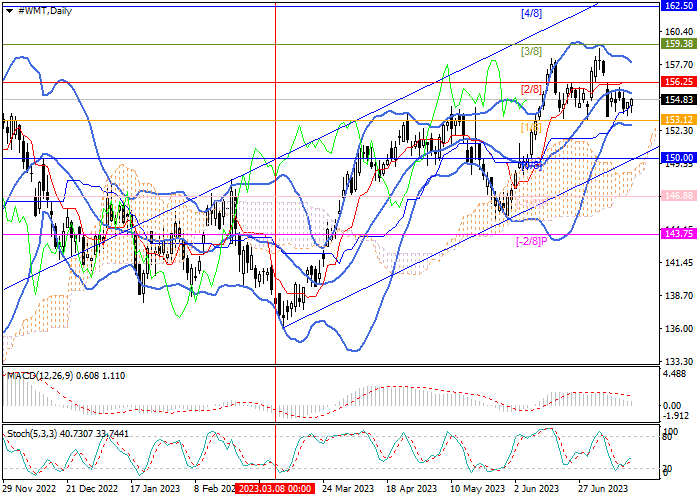
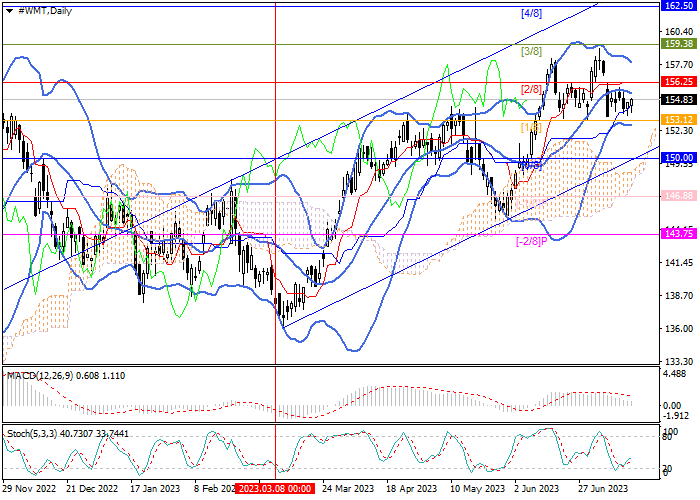
The quotes have been between 156.25 (Murray level [2/8]) and 153.12 (Murray level [1/8]) for more than a week. If the middle line of the Bollinger Bands and the reversal level of 156.25 (Murray level [2/8]) are broken out, the upward dynamics will be able to continue to the levels of 159.38 (Murray level [3/8]) and 162.50 (Murray level [4/8]). If the 153.12 mark is broken down, further movement to the lower border of the trading range and the ascending channel in the area of 150.00 (Murray level [0/8]) is likely.
Technical indicators do not give a single signal: the Bollinger Bands reverse horizontally, the MACD histogram decreases in the positive zone, but the Stochastic rushed up from the oversold zone.
Support and resistance
Resistance levels: 156.25, 159.38, 162.50.
Support levels: 153.12, 150.00.
Trading tips
Long positions can be opened above 156.25 with targets at 159.38, 162.50 and stop-loss at around 154.00. Implementation period: 5-7 days.
Short positions may be opened below 153.12 with a target at 150.00 and stop-loss in the area of 155.30.
Peringatan: Pendapat yang disampaikan sepenuhnya merupakan milik penulis dan tidak mencerminkan posisi resmi Followme. Followme tidak bertanggung jawab atas keakuratan, kelengkapan, atau keandalan informasi yang disediakan, serta tidak bertanggung jawab atas tindakan apa pun yang diambil berdasarkan konten ini, kecuali dinyatakan secara tertulis.
 Belum ada komentar. Jadil yang pertama untuk membagikan komentar.