


| Scenario | |
|---|---|
| Timeframe | Weekly |
| Recommendation | SELL STOP |
| Entry Point | 159.35 |
| Take Profit | 156.25, 153.12 |
| Stop Loss | 161.50 |
| Key Levels | 153.12, 156.25, 159.38, 162.50, 165.62 |
| Alternative scenario | |
|---|---|
| Recommendation | SELL LIMIT |
| Entry Point | 162.50 |
| Take Profit | 156.25, 153.12 |
| Stop Loss | 164.50 |
| Key Levels | 153.12, 156.25, 159.38, 162.50, 165.62 |
Current trend
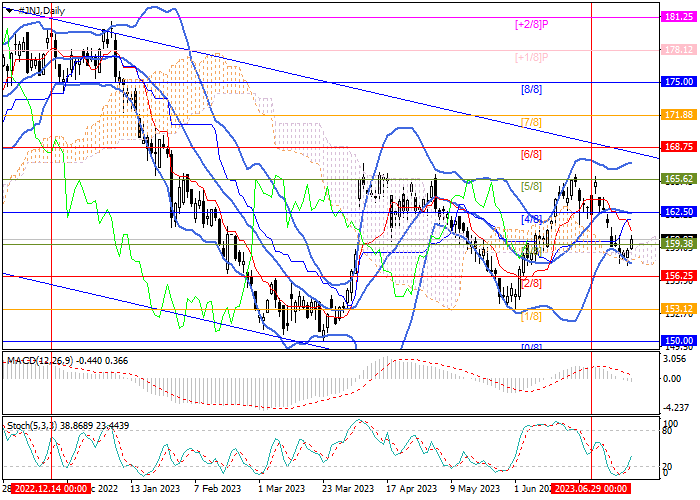
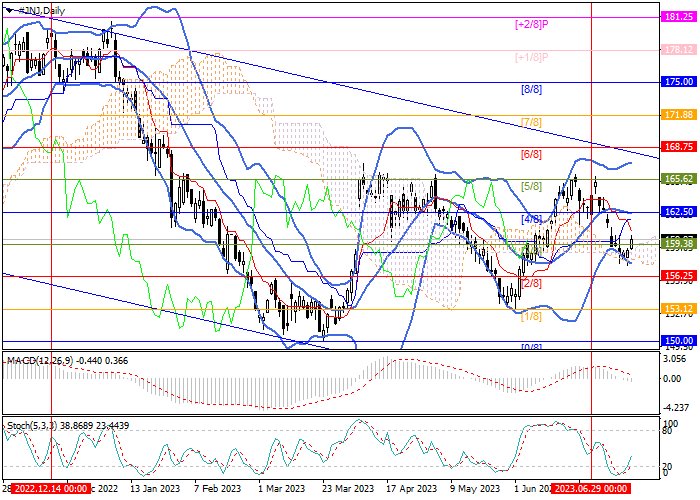
Since the beginning of this month, the shares of Johnson & Johnson, one of the world’s leading retail holdings, have resumed their decline as part of a long-term downward channel. The quotes reversed from 165.62 (Murrey’s level [5/8]), moved into the negative part of Murrey’s trading range and are currently trying to consolidate below 159.38 (Murrey’s level [3/8]), after which the negative dynamics will continue to 156.25 (Murrey’s level [ 2/8]) and 153.12 (Murrey level [1/8], area of May lows).
Technical indicators confirm the continuation of the downward trend: Bollinger bands are reversing downwards, and the MACD histogram has moved into the negative zone. Stochastic exit from the oversold zone does not exclude corrective growth to the area of the central mark of the trading range 162.50 (Murrey level [4/8]), supported by the middle line of Bollinger bands, however, it is unlikely to lead to a change in the current trend.
Support and resistance
Resistance levels: 162.50, 165.62.
Support levels: 159.38, 156.25, 153.12.
Trading tips
Short positions may be opened below 159.38 or when the price turns around 162.50 with the targets at 1156.25, 153.12 and stop losses at 161.50 and 164.50, respectively. Implementation period: 5–7 days.
Peringatan: Pendapat yang disampaikan sepenuhnya merupakan milik penulis dan tidak mencerminkan posisi resmi Followme. Followme tidak bertanggung jawab atas keakuratan, kelengkapan, atau keandalan informasi yang disediakan, serta tidak bertanggung jawab atas tindakan apa pun yang diambil berdasarkan konten ini, kecuali dinyatakan secara tertulis.
 Belum ada komentar. Jadil yang pertama untuk membagikan komentar.