


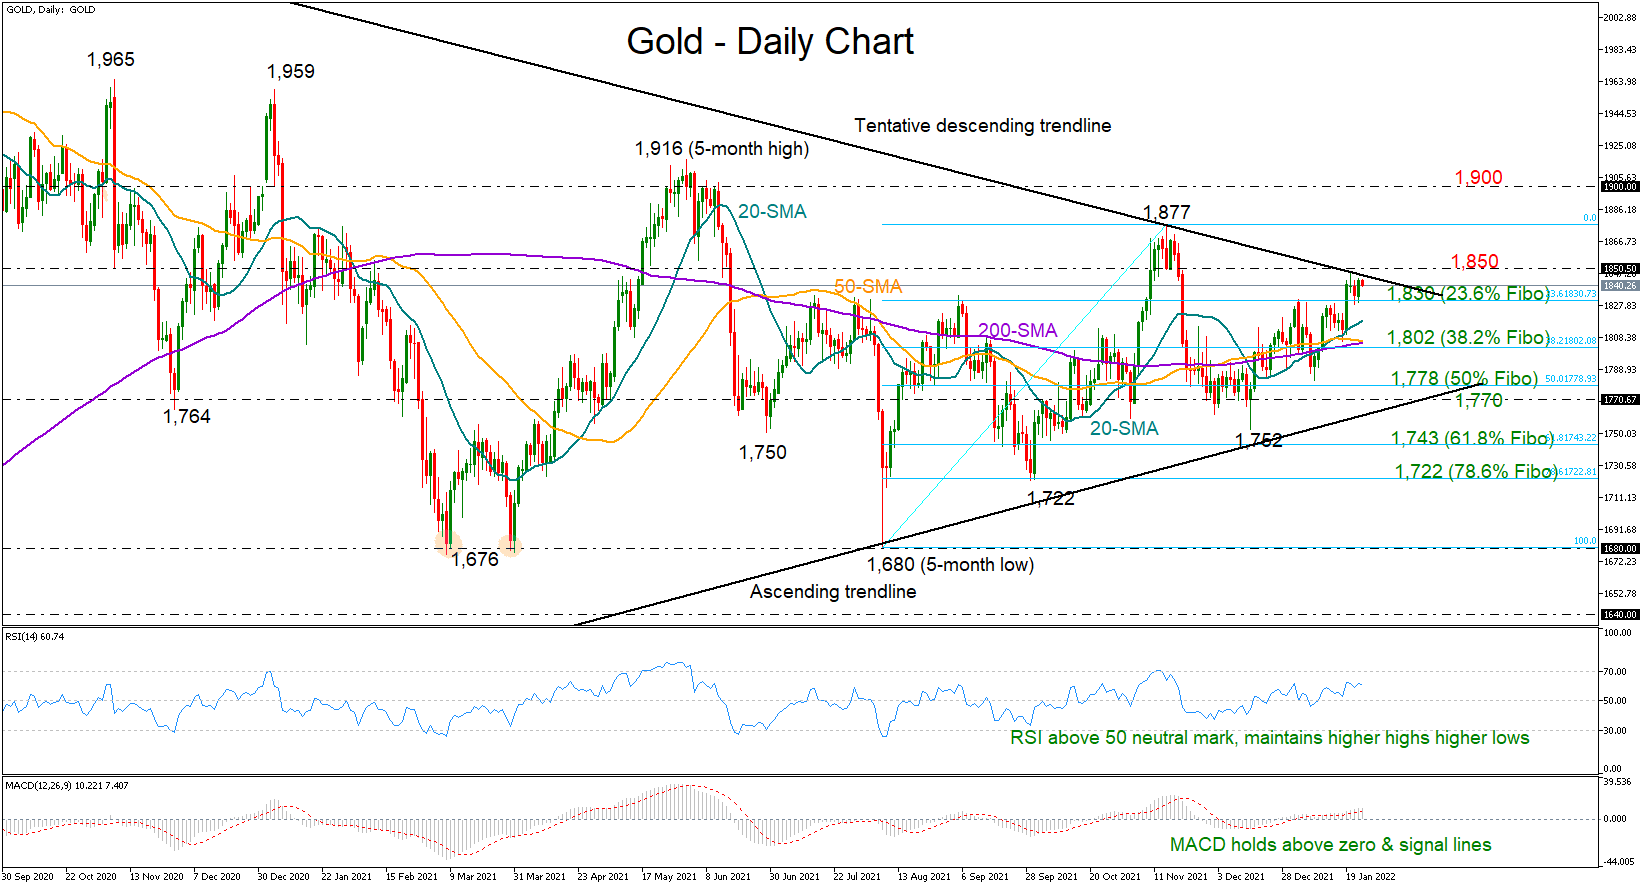
Gold shifted the spotlight to the descending trendline, which is connecting the all-time high of 2,079 from August 2020 with November’s 2021 peak of 1,877, following the break above the tough 1,830 ceiling.
The recent bullish double cross between the 20-day simple moving average (SMA) and the longer-term SMAs is promoting further progress in market trend, while the positive trajectory in the RSI and the MACD suggests an upside move in the price is more likely than a downside one.
Bullion, however, will need to successfully close above the resistance trendline and the 1,850 round-level to raise buying orders towards November’s top of 1,877. Running higher, the precious metal could face a critical test within the 1,900 – 1,916 region, a break of which would officially violate the long-term downtrend from the 2,079 record high, hopefully bringing the medium and long-term bulls into play as well.
Should the bearish scenario unfold, with the price pulling back below the 1,830 mark, the 20-day SMA could immediately attempt to block the way towards the 38.2% Fibonacci retracement of the 1,680 – 1,877 up leg at 1,800. Breaching the latter, the price will probably seek shelter around the 50% Fibonacci before it heads towards the long-term supportive trendline around 1,770. Failure to bounce here could see a more aggressive sell-off towards the 61.8% Fibonacci of 1,743.
In brief, Gold’s technical signals continue to flash green despite its latest stabilization, with buyers eagerly waiting for a sustainable move above the resistance trendline and the 1,850 number to further raise exposure in the market.
Peringatan: Pendapat yang disampaikan sepenuhnya merupakan milik penulis dan tidak mencerminkan posisi resmi Followme. Followme tidak bertanggung jawab atas keakuratan, kelengkapan, atau keandalan informasi yang disediakan, serta tidak bertanggung jawab atas tindakan apa pun yang diambil berdasarkan konten ini, kecuali dinyatakan secara tertulis.
 Belum ada komentar. Jadil yang pertama untuk membagikan komentar.